
"It's not agreeable to have to say this, but there is only room for one. Bolivar can't carry two."
O. Henry, "Roads of Destiny" (the story "The Roads We Choose"), 1910
Private markets value the builders of frontier models at 30x revenue — while the product itself has become several times cheaper in a year, its production cost has risen by hundreds of percent, and the sector's two largest listings are scheduled for the same month. This is a scenario analysis with a data cutoff of September 30, 2026, three probability-weighted outcomes, and a dashboard of leading indicators by which everything written here can be tested.
1. Introduction: the supercycle in a vise
1.1. The central thesis: the gap between valuation and unit economics
Over four years, closed AI labs have traveled from research teams to the largest private companies in history: private valuations of OpenAI and Anthropic across rounds and secondary deals ranged from $150 billion to figures around $1 trillion and above. A multiple of that scale implies not just fast growth but sustained gross-margin expansion: the market pays for a promise that each new dollar of revenue will yield more profit than the previous one. That promise is now being tested by the structure of the market itself. Hence the editorial question on which the drama of this text rests: why does the market's richest player sell its cheapest product and go more than seven months without announcing a flagship? (Section 3.)
How large the anomaly is can be seen from the multiple's sensitivity to its two denominators — valuation and revenue. Take the leader of the listing: a $965 billion mark at an ARR of about $65 billion is 15x trailing revenue; the same $65 billion at the discussed $2 trillion valuation is already 31x. If consensus 2028 revenue estimates of $190–200 billion materialize, the same $965 billion will be worth about 5x, and $2 trillion about 10x. The denominator moves the multiple three times more than any difference between "bubble" and "normal" — which is why the P/S base is declared explicitly in the scenario tree (Section 9), in the note to Table 4. The Cisco-2000 comparison, meanwhile, works not on the absolute level of the multiple but on its direction of movement after the peak: Cisco's multiple never returned to its pre-crisis level, while the private marks of this cycle's leader doubled from $380 to $965 billion in just February–May 2026 — a move, confirmed in hindsight by the secondary market: the valuation peak assembles exactly at the moment risk is handed to public markets.
The unit economics of inference are fundamentally different from classic software. Every user request is physical watts, silicon and memory; the gross margin of API inference is floored by the cost of renting or amortizing accelerators, electricity and data centers. In 2025–2026 that floor rose at unprecedented speed: contract DRAM prices rose roughly 400%, NAND roughly 600%, GPU rental has been getting more expensive since spring 2026, and queues to connect new data centers to the power grid are measured in years. A business model in which the price per unit of product falls by tens of percent per quarter while costs grow at double-digit rates is not a software model — it is an airline with even weaker pricing power.
At the same time the closed labs are squeezed between two classes of competitors with different budgets and different horizons. From above — hyperscalers (Microsoft, Google, Amazon, Meta), which fund AI capex out of the operating cash flow of their advertising and cloud businesses and can afford to sell intelligence at cost for years. From below — open weights: the DeepSeek, Qwen, GLM, Kimi and MiniMax families, offering frontier quality of 6–9 months ago free or at the price of electricity. The classic commoditization trap: the freshness premium on a model exists exactly as long as the gap between the frontier and open reproduction exists, and that gap is closing faster than the labs can monetize it.
1.2. The time horizon and the historical frame
The working timeline of the supercycle covers 2022–2028: from the release of ChatGPT and the first capital expansion of infrastructure to the calculated inflection point, when synchronized investment in semiconductor memory collides with a possible slowdown of hyperscaler capex. Within this horizon the autumn of 2026 occupies a special place — it is the window of maximum risk concentration: the sector's two largest listings, an aggressive price re-structuring of the model market, and peak inflation in the memory supply chain all coincide in a single quarter.
The duration of the supercycle is no accident: infrastructure bubbles fit into 5–6 years from the first impulse to the release, and the 2022–2028 frame obeys the same pattern. The reason is the overlap of four independent timers, each running on its own clock, but all anchored to the same capitalization cycle of 2022–2025 with a phase shift:
- 24–36 months — the lag of bringing physical capacity online. A decision to build a memory fab, expand CoWoS packaging, or add a substation for a data center becomes working tokens in two to three years; capacity ordered in the impulse phase of 2024–2025 enters the market exactly by 2027.
- 3–5 years — the accounting "depreciation wall". Accelerators bought at the 2022–2024 peak reach a reassessment of service life by 2027–2028, and the audit will for the first time reveal their real economic life (Section 6.2).
- 3–5 years — the liquidity window of venture funds. The life of a classic fund requires capital back in year five or six; the October 2026 listings are a direct consequence of fund deadlines, not of market conditions (Section 6.1).
- 3–4 years — the patience limit of enterprise budgets. Corporate pilots of 2023–2024 move by 2026 into demands for measurable ROI; budgets that fail to prove payback get closed — and it is here that the labs' NRR gets tested (Section 8.4).
The historical chronology confirms the same arithmetic: the British railway mania of 1840–1846, the dot-coms of 1995–2001 and the telecom fiber bubble of 1997–2002 all developed on one timetable — roughly five to six years between the first round of capital and the moment when opposing flows of supply and debt crush prices. The release in each case did not destroy the technology — it changed who pays for the infrastructure and who gets its cheap part. The supercycle of 2022–2028 fits this template. It also survives runs within a single technology: the wave of client-server systems and corporate networks in 1988–1994 — from the peak of equipment purchases to the release in the early-nineties recession — repeated the same arithmetic at a smaller scale (the periodization of the episode requires verification, Table 6). And it is important to understand what the template is not: five to six years is the life span of a financial bubble, not of technology diffusion. Electrification and telephony changed the economy for decades, because diffusion moves at the pace of adoption; a bubble lives at the pace of capital, and capital manages to overload supply within half a decade.
The four timers above set the cycle's internal clock. But there is a fifth — external, and it runs faster than the industry's. By September 2026, the AI supercycle is unfolding against two macro-structural skews, each of which has historically preceded systemic reversals on its own, and together they form what in mechanics is called resonant destruction.
The first skew is the cost of money. The US Treasury market is signaling stress not observed since the global financial crisis. The yield on 10-year Treasuries (UST 10Y) has settled at 5.24% — 109 basis points higher than a year ago; the 30-year yield recently broke 5.56%. Both levels are the highest since 2007: the market last saw such numbers directly before the global financial crisis, with the 10Y missing the 2007 close by two basis points and not yet exceeding it. Bond prices fall, yields rise, and for a sector whose valuations (P/S 30x) mathematically rest on cash flows of the 2030s, every basis point upward works like a road roller. A company with promised profit seven years out is a "long-duration" asset in bond-market terminology: at an effective duration of 17–23 years, typical for assets whose cash flows are concentrated beyond the seven-year horizon, a 150-basis-point rise in the risk-free rate cuts the modeled value by 25–35% with no change in revenue whatsoever. For neoclouds whose asset-backed loans are collateralized by rapidly depreciating GPUs (Section 2.2), a debt rollover at the current risk-free rate turns the projected unit economics negative before the first cash gap.
The second skew is stock-market concentration. The top 10 companies of the S&P 500 control about 40% of the index's capitalization. For scale: in periods of market stability this share runs 19–21% (at the end of 2015 — about 19%); at the absolute peak of the dot-com bubble in March 2000 it did not exceed 27%. Today's 40% is not just an exceedance of historical peaks; it is a level the market has not seen since the mid-1960s. An index in which ten names determine two-fifths of its value is structurally fragile: passive funds obliged to hold weights are already overloaded with exposure to the same papers, and any disappointment in one of the ten transmits to the whole market without damping. Unlike 2000, today's concentration does not rest on profitless companies: the index's top 10 account for roughly 34% of the S&P 500's aggregate profit (an estimate from consensus data, Table 6), and these are machines with real cash flows, not the "air" listings of the late nineties. That is true, and it is strong. But it has a second half, which the text's own audit points to: the resilience of that profit is secured by the very cycle the text is testing. The margins of chips, clouds and memory are a derivative of the capex race; if the race slows (Section 4), the top-10 profit share is protected by nothing except the very narrative it finances. The counterargument does not refute the fifth timer — it embeds itself in it: the profitability of the concentrate is a boom-phase phenomenon, like the concentration itself.
Resonance. Two skews land on the listing window. A concentration of 40% means index funds mathematically have nowhere to absorb new shares of a trillion-dollar company without forced rebalancing and sales of existing positions. Treasury yields above 5% mean the risk-free alternative — short bonds and money markets — competes for the investor's capital against a growth story with negative margins. In an environment where a 30-year paper pays a guaranteed 5.5% coupon, a P/S multiple of 30x must be justified not simply by revenue growth but by margin growth of tens of percentage points per quarter — exactly what the scissors of Section 8.3 make impossible. If the four timers set the cycle's internal arithmetic, the fifth timer sets the external pressure: it can slam the liquidity window shut before the labs report under GAAP. The historical parallel here is not the dot-coms. In 1999–2000, hundreds of empty companies listed into a market with 27% concentration; rates rose through 1999, peaking at 6.5% by May 2000, and the subsequent 475 basis points of cuts in 2001 alone saved no one — the wall of supply does not ask the Fed's permission. The current situation is closer to 1966: a narrow market, an expensive rate, and two or three names holding up the index — so far. And if in 2000 tightening was the tail of the cycle, after which the Fed quickly turned to easing, the 1966 rise in the cost of long money became the start of a multi-year trend — that episode ended with the 1969–70 bear market and a drawdown of a broad index by a third. Like every hypothesis in this text, the timer is falsifiable: a sustained return of 10-year yields below 4.5% alongside widening market breadth would remove the external pressure — and the cycle would be left alone with its internal arithmetic; both observations are included in the Section 9 dashboard.
For a correct historical frame, the habitual comparison with the dot-coms of 1995–2001 is not enough. The current cycle is best described by the telecom fiber-optic bubble of 1997–2002: WorldCom and Global Crossing built backbones on debt, Cisco sold them equipment with rising margins, and after the crash about 90% of the fiber lay "dark" — unused. Direct analogies require a map of roles, not a single name: labs and neoclouds are the operators and CLECs living on someone else's network; Oracle and CoreWeave are Lucent and Nortel, lenders of someone else's demand; Google, Amazon and Microsoft are AT&T with its own cash flow, which will survive the cycle; NVIDIA is Cisco, a survivor with a drawdown; the decommissioned GPUs of the future are dark fiber. The post-crash lesson matters too: cheap infrastructure did not kill the internet — it created YouTube and Netflix. Cheap decommissioned accelerators, as Section 7 will show, are highly likely to create local inference — the democratization that will become this cycle's second act.
A micro-model of the bullwhip effect for the hardware layer comes from the 2018 crypto cycle: when mining demand evaporated, NVIDIA crashed its revenue forecast within a single quarter, and the company's capitalization roughly halved. That episode demonstrates the speed at which demand for computing hardware unwinds when a buyer financed by speculative capital disappears. A similar mechanism, stretched over semiconductor memory, is described in Section 5.
1.3. The structure of the work and the editorial hook
The logic of exposition moves from financing to physics and back to finance. Section 2 examines the circular economy in which Big Tech investments return to their own income statements as cloud revenue. Section 3 is devoted to the Google factor — including the author's hypothesis of a strategic pause ahead of a price attack. Sections 4 and 5 describe the redistribution of value toward physical infrastructure and the cyclical trap of the memory market, which sets the rigid timing of 2026–2027. Section 6 analyzes the IPO window; Sections 7 and 8 — the democratization of inference and the economics of overproduction; Section 9 condenses everything into three scenarios and a dashboard of leading indicators.
The editorial question posed in the first paragraph of the text (1.1) — why the market's richest player sells its cheapest product and has gone more than seven months without announcing a flagship — unfolds in Section 3 into an explicit hypothesis. The answer proposed here is not an engineering lag but a rational landlord's strategy, and unlike most judgments about corporate motives, this hypothesis comes with four distinguishing criteria: the market will test it within the coming months.
2. The circular economy: Cloud-for-Equity
2.1. The vendor-financing scheme
The defining feature of AI-cycle financing is the closed loop of cash flows: large technology companies invest in model developers, and the developers return the received funds as payment for compute to the very same investors. The most visible contours of this circular economy took shape in 2025 and are described in the business press; a summary of the key deals is given in Table 1.
Table 1. Contours of the circular economy (2025–2026)
| Deal / loop | Scale | Value-return mechanics | Data status |
|---|---|---|---|
| NVIDIA → OpenAI | up to $100 B | Framework investment agreement tied to deploying 10 GW of capacity on NVIDIA accelerators; the money returns as vendor revenue | announced, terms are framework-level |
| OpenAI → Oracle | ~$300 B over 5 years | Cloud compute contract; Oracle raises debt (~$18 B for Project Jupiter) to build for a single client; 24.09.2026 — force majeure notice (2.2) | per press reports; force majeure confirmed |
| OpenAI → AMD | 6 GW deployments | Warrants for ~160 million AMD shares at symbolic strike price against purchase volumes | announced |
| Meta → Blue Owl (Hyperion) | $27 B SPV | Off-balance-sheet project financing of a data center via a private-credit structure | confirmed |
| CoreWeave ↔ NVIDIA | multi-layered | NVIDIA is shareholder, supplier and guarantor of the neocloud's debts — a neocloud buying its accelerators; CoreWeave is the public "pure play" of this scheme | confirmed |
| Microsoft ↔ OpenAI | dividend rent and royalties | Revenue shares, Azure credits and convertible instruments in exchange for cloud exclusivity | confirmed |
Sources: corporate announcements, business press 2025–2026; the volumes of some deals come from media reports without public verification. A detailed breakdown of statuses is in the appendix, Table 6.
The economic meaning of the circular structure is the transformation of capital expenditure into revenue. A dollar NVIDIA invests in OpenAI returns as accelerator revenue; a dollar Microsoft invests returns as Azure revenue; a dollar Oracle raises against an OpenAI contract grows its backlog and valuation before real profit arrives. In such a system announced obligations work better than revenue: they create modeled future profit immediately, while actual margin arrives with a delay — or never. The loop is not an invention of 2025, and it has a precedent with exact bookkeeping: the vendor financing of the telecom bubble. In 1999–2000, Lucent and Nortel lent to their own customers so they would buy their equipment, and booked that demand as their own future revenue. When operators began to fall, the vendors were left holding other people's paper: in February 2001 Lucent was forced to borrow $4.5 billion to avoid a junk rating and to restate its accounts; Nortel went from a C$398 billion capitalization in September 2000 to under C$5 billion by August 2002 and filed for bankruptcy in 2009. The mechanics match Table 1 not in form but in entries: the vendor lends to someone else's demand and capitalizes someone else's obligations as its own revenue before that unit economics can earn it.
2.2. Take-or-pay, RPO and the hidden debt ballast
Long-term compute contracts have a take-or-pay structure: the client commits to paying for reserved capacity whether or not it is needed. For the supplier this is a risk-free money model: the obligations are fixed in the remaining performance obligations (RPO) metric and are immediately capitalized by the market. For the customer it is a growing unrecognized debt ballast: OpenAI's total obligations to compute providers were estimated by the company itself at around $1.4 trillion, against annual revenue two orders of magnitude smaller. No company with that gap between obligations and revenue base has ever approached the public market.
The second layer of hidden ballast is depreciation accounting. Hyperscalers in 2023–2024 extended the assumed service life of servers from three-four to six years, which adds billions to reported profit every quarter through lower depreciation charges. The decision was made on the assumption that the equipment would remain in demand for the whole period; in a cycle with annual accelerator generations (Blackwell → Rubin → the next generation), the assumption looks optimistic. The first public 10-Ks of the labs and neoclouds will become the moment of truth: the auditor will have to assess the real economic life of GPUs bought at peak prices.
The third layer is private credit. Record volumes of data-center project financing (structures like Hyperion from Meta and Blue Owl) move credit risk from the hyperscaler balance sheet to the opaque private-debt market. Unlike the telecom bubble, where the leverage sat on operators' balance sheets, the leverage of the current cycle is smeared across SPVs, neoclouds and private credit funds — this makes systemic risk less visible in public reporting, but no less real. Oracle, with sharply widened debt spreads, serves as the marker: the market has already begun repricing the credit quality of businesses dependent on a single anchor client. On September 24, 2026, that marker turned into a mechanism with dates. For Project Jupiter — a campus for AI workloads in New Mexico with up to 2.45 GW of Bloom Energy gas fuel cells — Oracle sent a force majeure notice to the developer (a Blue Owl unit): the Energy Transfer pipeline has slipped by roughly half a year, to February 1, 2027, after regulatory refusals and a route change; the air-quality permit has not been issued, its review deadline is November 23. Oracle is not exiting the project — it is deferring payments in case commissioning slips past 2028; the shares reacted with a 3–4% fall, and the project's debt to a bank consortium (~$18 B) trades with a raised spread — the bank paper went at about 89 cents on the dollar. Look closely at the chain of damage: the client pushes delays onto the developer, the developer onto the lender, the lender onto the bond market. This is not an echo of the telecom cycle — it is that cycle's mechanics in working condition, with dates and prices (indicators in the Section 9 dashboard).
The most vulnerable link of this construction is the neoclouds. CoreWeave, Nebius and Lambda built capacity on billion-dollar debt obligations collateralized by the accelerators themselves (asset-backed loans): the lender issues money against GPU collateral that must pay for itself and the interest. The mechanics break when spot rental prices fall — and the hyperscalers' price war, which does not need rental margin, presses exactly there. Collateral value falls in sync with revenue, and neoclouds hit cash crunches and credit events before software AI startups: they will pay off the cycle's debts first. CoreWeave, as the public "pure play" of this model, will be the main barometer — its reporting and credit spreads will show stress before it reaches private companies (the indicator is included in the Section 9 dashboard).
2.3. The senior creditor's position at default: acqui-hire as an absorption mechanism
The circular economy gives hyperscalers not only revenue but control. An investor who is simultaneously the infrastructure supplier and holder of convertible instruments occupies the position of senior creditor at the debtor's moment of stress: its claims are protected, and its absorption options get cheaper. The precedents of 2024 show what the end of such a trajectory looks like: Microsoft paid about $650 million for the team of Inflection AI (which had raised more than $1.5 billion), Amazon absorbed the Adept team, Google — the Character.AI team for ~$2.7 billion. In every case the investors received a partial return, the founders got jobs and non-compete signatures, and the licensed models stayed with the buyer for a fraction of the invested capital.
The acqui-hire formula — "team and IP for pennies compared with the capital raised" — works best when there is no intermediate liquidity between the company and the stock market: a private company with an exhausted round has no price at which it could refuse the deal. A public listing changes the mechanics but not the outcome: after an IPO, multiple compression makes a stock-for-stock absorption cheap, and the opening of lockups six months after listing — that is, approximately in the first or second quarter of 2027 — opens personnel attacks on employees with depreciated options. Both branches will be analyzed in Section 6 and Section 9.
2.4. Sovereign capital: the change of LPs and the geopolitical fragmentation of the API
The classic venture model — build a company, burn capital at the frontier, return the money through an IPO in year five or six — broke against the scale of required capex: rounds measured in tens of billions exceed the size of individual venture funds and turn traditional LPs from anchors into extras. Replacing them come sovereign funds: MGX from the UAE (a member of the Stargate consortium), Saudi Arabia's PIF with the Humain infrastructure project, G42, embedded in the Microsoft partnership. Multi-billion inflows of sovereign capital into infrastructure SPVs and the labs themselves change the nature of the holders: a venture fund needs an exit within the fund's life; a sovereign fund does not. The October 2026 IPO remains an exit for venture books (Section 6.1), but the anchor-holder structure after listing is already different: capital with a twenty-year horizon, for which financial return is not the only goal; the second goal is compute sovereignty.
The consequence is the geopolitical fragmentation of the API market. In exchange for capital, the labs build isolated regional clusters in the Middle East and Asia, accepting strict data-localization and exclusivity conditions; a single "global API" splits into domains with different regulation, prices and availability regimes. This adds OpEx and political risk where there used to be the clean margin of a software subscription — the labs' business looks even less like SaaS and even more like heavy utility infrastructure with a geopolitical superstructure. For the circular economy (Table 1), sovereign capital is a new external contour: the money comes not from hyperscalers' advertising businesses and not from venture LPs but from states' commodity balances, and the requirements for its return are set by the horizon of countries, not funds. The state in this cycle is not only a regulator but a party to the balance sheet. The defense cloud contract JWCC, worth $9 billion, is split among AWS, Google, Microsoft and Oracle — all major participants of the cycle are embedded in Pentagon supply; the FTC's 6(b) report documents regulatory attention to the labs' partnerships with cloud providers — that is, to the very circular economy (Table 1). The consequences for the scenarios are double. First, under stress, labs and suppliers with government contracts will get "rescue by contract": part of the bear branch — formal bankruptcies — is capped from above. Second, and more important for the risk picture, government contracts do not cure the counterparty's credit risk: they save operations, but not the private-debt rollover sitting in project structures (2.2). Both safety valves are accounted for in the probabilities of Section 9.
3. The Google factor: vertical integration and the strategy of waiting
3.1. Token cost: the three-link chain versus vertical integration
The economics of a closed lab rest on a three-link supply chain: NVIDIA sells accelerators with a gross margin around 70%, the cloud provider adds its margin and cost of capital, and the lab adds its own on top. Every level of the chain requires profit, and all three are financed out of the final token price. Google in this chain is all three levels at once: its own silicon (TPUs), its own data centers, its own end service. Even accounting for HBM memory and TSMC remaining external, vertical integration removes at least two layers of margin and — more importantly — two layers of queues: access to capacity stops being the bottleneck.
The gap reproduces itself across silicon generations. An independent lab is tied to NVIDIA's product cadence and pays full price for every new platform generation; Google, over the same interval, manages to swap one or two generations of its own silicon: inference has moved to TPU v6 Trillium, the v7 generation is deploying, v8 is in development, and v5 is receding into the past. Each generation delivers a jump in performance per dollar of capital and per watt — meaning the beneficiary is the token's cost, not the peak figure for marketing tables. As a result, the cost gap between vertical integration and the three-link chain stops being a constant: every TPU generation adds a new layer to the already observed four-to-eight-fold price difference, and the conservatism of this estimate lies in the fact that Google's queue at TSMC is contractual, not market-based.
The consequence of this difference is the structural, not tactical, character of the price advantage. While Gemini Pro sells at $12 per million output tokens and Anthropic's flagship at $20–25, a four-to-eight-fold difference cannot be explained by aggressive pricing in the narrow sense: it reflects a difference in cost. A hyperscaler that monetizes the model through distribution — search, office suite, mobile platform — does not need API margin and can therefore hold a price at which an independent lab fails to cover even the rising cost of rented compute.
3.2. The price war in the Pro class: how the ladder collapses
The correct price comparison is not between Flash and Opus (they are different product classes) but between the best models of each vendor. As of late September 2026 the ladder looks like this: Gemini 3.1 Pro — $12 per output token-million, GPT-6.1 Sol — about $10 (one fifth of OpenAI's own flagship's price), Claude Opus 5.5 — $20, the discontinued Opus 5 — $25, GPT-6 Astra — $50. The frontier's mid tier — the $10–12 zone — has already been commoditized by the participants themselves: OpenAI cut it with its own Sol line, Google holds it with Gemini Pro. The only floor where margin remains — the $20–50 premium — is eroding fast: −20% at Anthropic on September 22, −80% at OpenAI between Astra and Sol in 26 days.
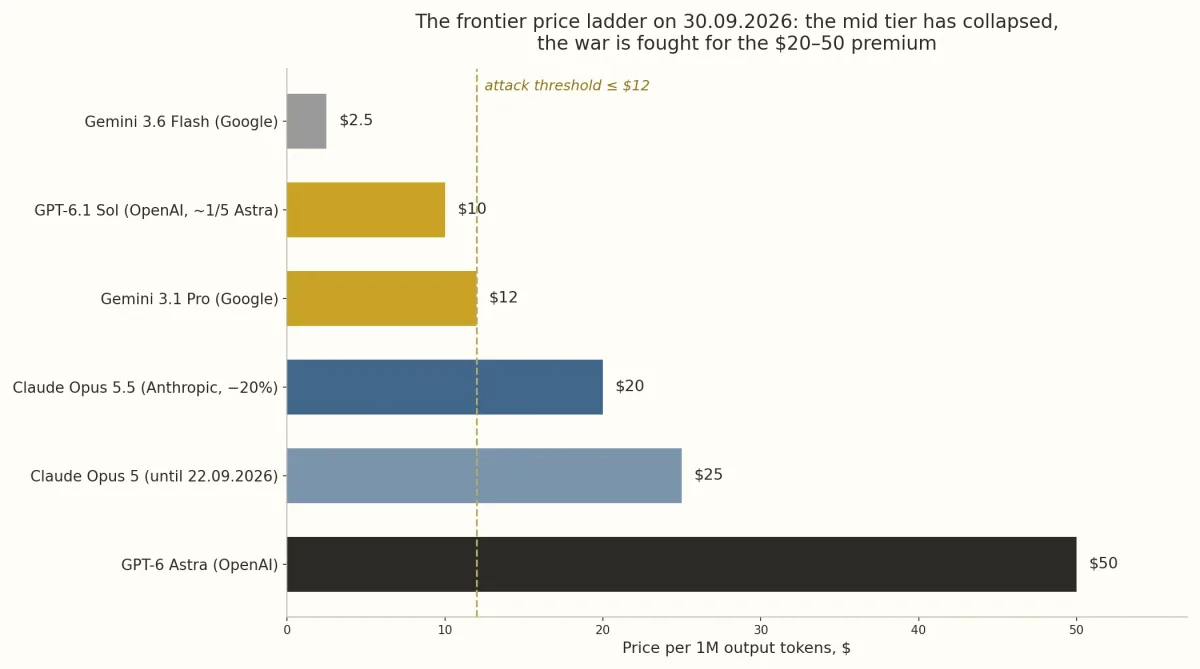
The $12 threshold per million output tokens is not an arbitrary figure: it is Google's own current price. The base case of the price attack reads as follows: Gemini 4 Pro launches at flagship-class quality for no more than $12 — that is, doubling the value proposition at a constant price. Every dollar below that mark raises the temperature of the attack: a launch below $10 collapses the whole ladder to the Flash segment and leaves Anthropic a choice between unprofitable price-matching and losing volume. According to September 2026 press reports, Gemini 4 Pro pricing is being discussed in the range of $2.25/$11.25 to $3/$12 per million tokens — if these figures are confirmed, this is a transfer of the whole ladder downward, not a spot discount (status: requires verification, Table 6). In any variant, the blow lands on NRR — the key revenue-retention metric the public market will see for the first time in the labs' post-listing reports. Finally, the unit of comparison itself is conditional: the price per million tokens says nothing about the price of a solved task — after the agentic and reasoning multipliers (10–100x, Section 8.1) and the reliability tax (30–50x, Section 8.4), a cheap token may mean an expensive task, and vice versa; the correct vendor-comparison metric is the cost of a closed task, and this distinction becomes central in Section 8.
3.3. The landlord: the author's hypothesis about Google's pause
In February 2026 Google shipped Gemini 3.1 Pro — and then went more than seven months without a flagship announcement, while Anthropic shipped six iterations of its line (4.6 → 4.7 → 4.8 → 5.0 → 5.1 → Opus 5.5) and OpenAI at least six (GPT-5.3 → 5.4 → 5.5 → GPT-6 Astra → Sol/Luna → GPT-6.1 Sol), three of them in the four weeks before the listing. The business press explains the pause with quality problems on the Pro models. What follows is an alternative interpretation; it is the author's personal judgment and is meant by design to be read as a hypothesis, not an established fact.
The hypothesis rests on the asymmetry of two roles. Google is not a predator on someone else's territory but a landlord: the only market participant earning rent from other companies' models — TPUs in Google Cloud run the workloads of Anthropic and other frontiers, and every premium token they produce brings Google rent from someone else's premium floor. While rivals' models monetize better on its silicon than its own does per token, crushing their premium means cutting its own rent; a landlord always has a fallback income — in the worst case for its own model, it earns on its competitors' silicon. Google funds AI capex out of an operating cash flow of $140–150 billion a year and does not depend on external capital; OpenAI and Anthropic live on investor money and must return it through an IPO. The competitors have a deadline; Google does not. The rational strategy in that position is to let competitors load up maximally on debt obligations and capex, wait for the listing at which risk is transferred from venture funds to the public market, and only then move the price. The classic strategy template is commoditize your complement: value flows out of the commoditized model layer into the distribution and silicon layers, where Google already dominates. The internal precedent is the Android strategy, which destroyed licensed competitors with free-ness while collecting value in search and the app store.
The technology stack makes the strategy executable. A Gemini 4 Pro price attack in the ≤$12 zone will rest on the economics of Google's own fabs and its own v6/v7/v8 chips: for Google even a dumping price remains above cost, while OpenAI and Anthropic can match it only in deep loss — their COGS includes NVIDIA's margin, the cloud's margin and the market price of HBM. Dumping as a weapon belongs to whoever has the lower cost base. In that sense the pause in flagship releases is not lost tempo but waiting — for the new TPU generations to fill the data centers and bring the cost of the coming strike to the cycle's minimum.
Table 2. Chronology of the asymmetry, February–October 2026
| Period | Anthropic | OpenAI | |
|---|---|---|---|
| February | Gemini 3.1 Pro ($2/$12) | Claude 4.6 | GPT-5.3 |
| March–June | — (silence 7+ months) | 4.7, 4.8, 5.0, 5.1 | GPT-5.4 ($2.5/$15); S-1 filed 22.05 |
| July–August | — | — | GPT-5.5 ($5/$30); Gemini 4 confirmed in post-training |
| September | — | Opus 5.5 — 22.09, −20% price; over 30% of tokens on OpenRouter | GPT-6 Astra $10/$50 — 03.09; Sol/Luna −50% — 22.09; GPT-6.1 Sol ~1/5 price — 29.09 |
| October (IPO window) | Gemini 4 Pro — launch forecast | Listing; the $965 B mark — post-money round | Listing, October |
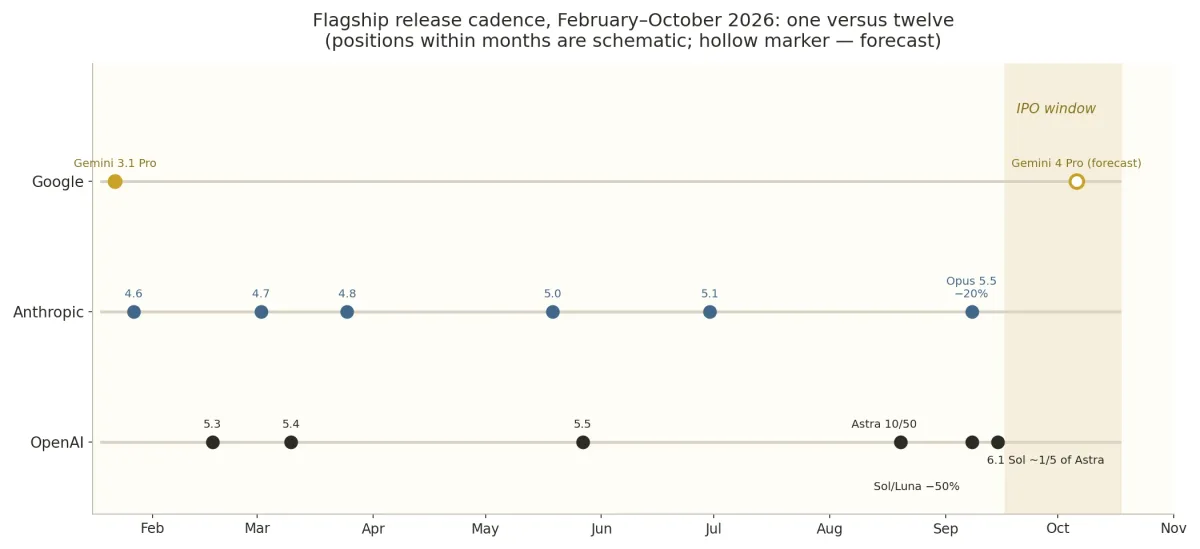
The hypothesis carries three honest limitations. First, antitrust makes a direct acquisition of OpenAI or Anthropic unlikely — the "capture" will work through customers, people and cheap deals for small labs, not through large-scale M&A. Second, Google's own capex is also record-breaking: the company is not waiting for free, it is waiting with a loaded balance sheet. Third, open weights may commoditize the premium floor before Google plays the endgame — and then its advantage depreciates along with everyone else's.
That is precisely why the hypothesis is formulated through distinguishing criteria: observables that only the strategic "landlord" version predicts and the simple "dumps because it can" version does not. The outcome by itself does not distinguish the versions — if both explain the same release, you must test not the outcome but the road to it. There are four such observables. The first is a softening of Google's capex guidance: a strategist prepares the strike at minimum cost, and a 2027 plan growing slower than the market is its preparation. The second is bundling the tariff with distribution: the Gemini 4 Pro tariff will appear not on its own but tied to Workspace and search — the landlord monetizes through distribution, not API. The third is synchronizing the pause with the listing window: on the engineering version the dates are random; on the strategic one they align with the transfer of risk to public markets. The fourth, the strongest, is preserving Google's own premium floor: "dumping for its own sake" would collapse the whole ladder, including Google's upper segment, but a rational strategist with its own premium product cuts the rivals' premium while holding its own; if, after the attack, Google's expensive upper class remains on sale while competitors are locked below — that is the signature of strategy, not temperament.
4. Hardware strikes back: the redistribution of value added
4.1. The gap between capex and software revenue
The combined capex of the big-four hyperscalers grew from roughly $150 billion in 2023 to an estimated $380–400 billion in 2025, and 2026 plans run at $600–650 billion — Amazon alone has announced raising its 2026 cash capex to $220 billion. Against that stands the revenue of AI software proper: for 2026, the combined revenue of OpenAI and Anthropic is estimated at $54–80 billion (an estimate from company disclosures and consensus), and generative AI across the whole economy, per Bloomberg Intelligence, reaches $2.3 trillion only by 2032. The pressure is measurable inside a single company, from its own disclosures: Anthropic's future cloud-and-compute obligations are $518 billion against $20.28 billion of cash on its balance sheet — 25.5 dollars already promised per dollar of available liquidity (figures — company disclosures; the comparison — the author's; status — in Table 6). This is a proportion of a different kind than the rent of capex to revenue: not "invested vs earned" but "already promised vs in the till" — promised in the currency of compute contracts whose payment does not depend on whether the premium floor is shrinking (Section 8). The cumulative gap between invested capital and earned revenue for 2025–2028 the author estimates at more than $4 trillion — with a direct caveat: this figure does not follow from the components given in the text, because 2027–2028 capex figures are not given in the text; it is an extrapolation of the trajectory, not a sum, and should be read as an order of magnitude (methodology in the appendix).
Where does this capital leak? The waterfall of value per dollar of final AI spending looks roughly like this: a large share settles with the accelerator maker and its chain (TSMC, packaging, HBM memory), the next big chunk goes to power companies and data-center builders, then to network equipment and cooling suppliers. The author's estimate: two-thirds to four-fifths of the cycle's investment goes into physical infrastructure, turning software companies into low-margin intermediaries between silicon owners and the consumer. In this sense the section's title should be read literally — with one caveat about phase: the hardware revenge describes the boom phase; the bust phase belongs to whoever uses the cheapened compute (Section 9.3).
The constraint of the physical stack is multi-layered, and memory is only its most discussed layer. The first is packaging: even with free wafer capacity, the main limiter of frontier accelerator output remains TSMC's CoWoS 3D packaging, which combines the logic die and HBM stacks in one package; the queues for CoWoS lines are booked out for months, and it is the pace of its expansion that determines when the output "bottleneck" eases (the indicator is included in the Section 9 dashboard). The second is the hyperscalers' own ASICs: AWS Trainium2 and Inferentia2, Meta MTIA, Microsoft Maia 100 — moving internal inference from GPUs to in-house chips cuts Big Tech costs 30–50% versus accelerator purchases (an industry estimate); every such move is minus orders for NVIDIA and minus rental volume on which the labs and neoclouds sit. The third is the network: switches and interconnects (InfiniBand, RoCEv2) make up to 15–20% of data-center cost, which makes multi-node clusters economically unreachable for small players and adds a barrier to the entry of new neoclouds.
4.2. The energy ceiling
The physical limiter of the supercycle is electricity. Queues to connect new industrial loads to the grid in the US stretch five to seven years, the gas-turbine backlog is booked out to the end of the decade, and the largest technology companies sign direct agreements with nuclear generation — from reviving units at the Three Mile Island site to contracts with small modular reactor developers. For labs renting capacity, energy is an external factor of rising costs; for vertically integrated players it is another layer where infrastructure ownership becomes a competitive advantage. In any variant, energy works against the margin of independent inference and in favor of asset owners. A fresh illustration is Project Jupiter (Section 2.2): the Energy Transfer pipeline slipping half a year and the unresolved air-quality permit move the 2.45 GW campus's commissioning not because money is missing but because physical plumbing and regulatory process run at their own pace — and every month of delay is paid by whoever took on the project debt.
4.3. The bullwhip effect and its timing
The bullwhip effect in supply chains consists in this: a small slowdown of end demand is amplified many times as it moves up the chain — the retailer cuts its order by 10%, the distributor by 30%, the manufacturer by 60%. In the AI cycle the whip is charged especially tight, because orders are duplicated (hyperscalers reserve capacity with several suppliers simultaneously), take-or-pay contracts encourage inflated reserves, and the fear of missing the pre-IPO window stimulated purchases ahead of need. The 2018 crypto cycle showed what the release looks like: one quarter of forecast revisions — and minus half the leader's capitalization.
The critical question is synchronization. If a slowdown of hyperscaler capex growth coincides in time with the new memory fabs reaching full capacity (Section 5) and with the public market's first disappointments in the labs' reporting (Section 6), the correction will take the character of a step function, not a smooth slowdown. It is exactly this synchronization of four events — the IPO, the Gemini 4 Pro release, the memory capacity cliff, and the lockup openings — that makes 2027 the calculated point of maximum tension of the whole cycle.
4.4. The legal brake: the end of the free-internet era
Physical constraints — silicon, memory, energy — are only half the cost; the other half is formed in the courts. Rights-holder lawsuits — The New York Times v. OpenAI and Microsoft, Getty Images v. Stability AI, a wave of class actions by authors and publishers — combined with the opt-out regime of the European DSM directive make the bet on free scraping legally untenable: every training epoch without a license turns into a potential retroactive payment. Notably, even rulings that formally found training to be fair use (the Bartz v. Anthropic and Kadrey v. Meta cases, 2025) record the same direction: the courts emphasize market harm to rights-holders and condemn pirate sources — a legal entry to data costs money. The market's answer is already visible: the labs sign licensing contracts with News Corp, Reddit, Financial Times and Axel Springer — per press reports, for hundreds of millions of dollars over the contract term. Data royalties stop being a hypothetical risk and become the de facto industry norm.
This forms a new structural cost layer — "data as the new HBM". The memory shortage limits the volume of inference; the shortage of clean licensed data limits the training of the next generations. Labs whose early models grew on "gray" scraping face a choice: buy licenses retroactively, crushing margin, or train new versions on narrow corporate datasets, losing universality. In both cases the value in the value chain migrates from the "intelligence packagers" to the owners of proprietary data — media holdings, photo stocks, Reddit, corporate and medical archives — which levy a "cognitive-royalty tax" on every token trained or generated on their content. The engineering attempt to escape this tax — through synthetic data — runs into its own ceiling; the next subsection is devoted to it.
4.5. The epistemic ceiling: the synthetic-data trap
Facing the legal blockpost of 4.4 and the prospect of the "cognitive-royalty tax", the labs try to replace human content with synthetic: teach the models to generate their own training corpora, closing the training loop. In practice the strategy runs into a constraint described in the academic literature as informational autophagy (model collapse): a model fine-tuned on its own outputs loses distributional variance and "collapses" — an effect documented in peer-reviewed work (Shumailov et al., Nature). Synthetics work only in closed, formalizable environments with a deterministic verifier and absolute ground truth: a compiler for code, a solver for theorems, a simulator for games. It is in these domains that reasoning-model quality grows — a real but narrow channel of improvement.
In open domains — medicine, law, strategic consulting, market analysis — no deterministic verifier exists: reality is dynamic, contextual and does not reduce to a binary loss function. Fine-tuning on one's own outputs here produces epistemic drift: the model optimizes for an "average" synthetic reality, accumulates hidden hallucinations and loses tail events — the rare exceptions on which the value of frontier AI for the enterprise client is built. With every generation of synthetic fine-tuning the model becomes more confident in its errors and less capable of working with the anomalies of the real world.
Economically, replacing human content with synthetic does not reduce the final cost — it moves it between accounting lines: from "licensing fees" (COGS) to "verification systems, RL infrastructure and compute overhead for defect filtering" (CapEx/OpEx). The legal tax of 4.4 becomes an engineering one: without a constant inflow of fresh human data reflecting the unpredictability of the real world, the model falls into quality deflation. Data turn out to be not just expensive — physically irreplaceable, and the monopoly rent of dataset owners (4.4) strengthens: it cannot be engineered around.
5. The cyclical trap of the memory market 2025–2027: the 18-month lag, the CapEx race and the HBM vacuum cleaner
5.1. The capex lag and the planning paradox
The semiconductor memory market is governed by an 18–24-month capacity cycle: from the decision to build a clean room or buy lithography scanners to the first commercial wafers with a high yield takes a year and a half. The "big three" — SK Hynix, Samsung, Micron — are making their 2025–2026 investment decisions on the basis of extrapolating the current exponential demand from NVIDIA, Google and Microsoft. The industry builds capacity on the hypothesis that hyperscalers will keep growing accelerator purchases at the same pace into 2027–2028; the equipment books no alternative scenarios. This is the planning paradox: the more confident today's shortage, the harsher tomorrow's surplus.
5.2. The split of the market and the fab race
SK Hynix keeps a controlling share of HBM — around 50–60% — on the strength of its NVIDIA partnership and expands aggressively: the M15X fab in Cheongju comes online in the second half of 2026, the Yongin megacluster with a first launch in 2027; the company has announced a multiple increase of DRAM output in 2026. Samsung, which lost the early HBM3e batches on yield, drowns the problem in capital: expanding wafer processing from ~180 thousand to ~250 thousand wafers per month by 2027 (an estimate, per industry reports), aiming at Gemini and NVIDIA orders on price. Micron holds 15–20% of the market, relying on energy-efficient versions of HBM3e/HBM4 and supply for specialized ASIC accelerators. The background process is China's CXMT: while the Koreans and Americans went into HBM, it invests in legacy DRAM and pushes the big three out of the standard-memory market for cheap electronics, further narrowing the retooling flexibility of Western fabs.
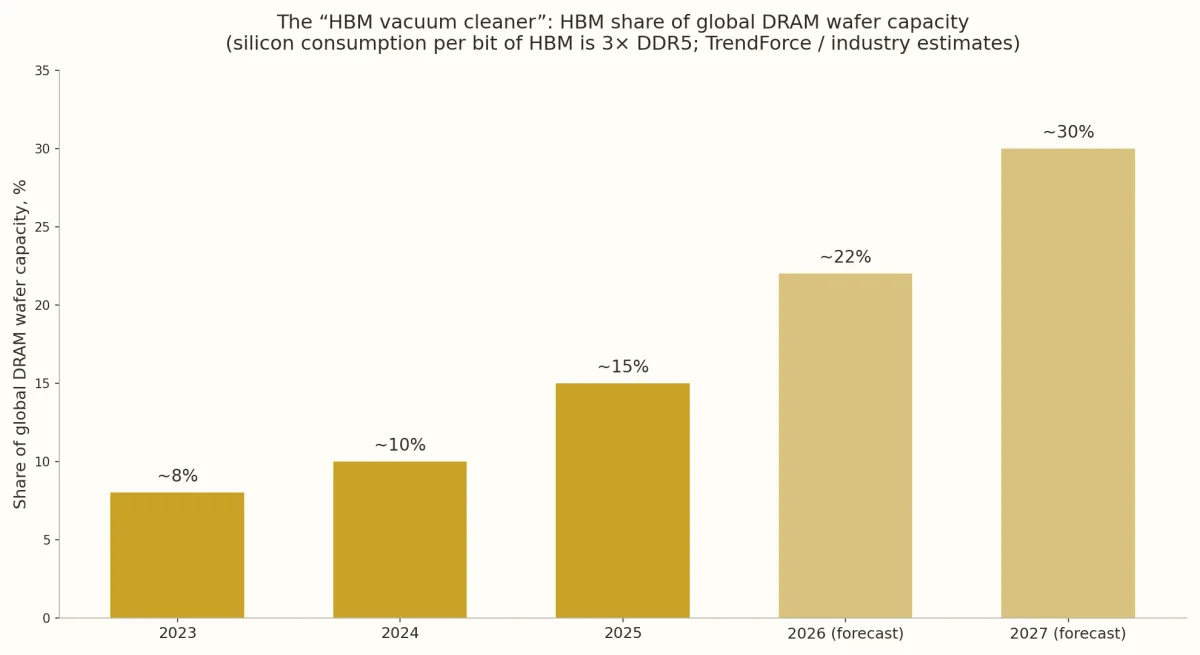
5.3. The HBM vacuum-cleaner effect: the production skew and the measurable shortage
The design features of HBM — vertical die stacking through through-silicon vias (TSV) and low yield at the 3D-packaging stage — mean that producing one bit of HBM requires roughly three times more silicon wafers than producing a bit of standard DDR5. By 2027, HBM will absorb about 30% of global DRAM wafer capacity, per consensus industry estimates, versus under 10% in 2023 (Fig. 3). The direct consequence is a structural shortage of ordinary memory: DDR5, LPDDR5X and GDDR7 for the consumer and automotive markets. This shortage is no longer a forecast but a measurable fact: contract DRAM prices have risen roughly 400% since late September 2025, NAND roughly 600%, and analysts expect further increases. The fabs are in no hurry to turn around: gross margin in HBM reaches 75–85%, and squeezing the maximum out of the premium segment beats serving a mass market drowning in shortage.
For the timing of the capacity cliff it matters that memory is only one of the links moving on the same cycle. TSMC's CoWoS capacity expansion follows the same "shortage today — surplus tomorrow" logic: queues sold out months ahead will dissolve simultaneously with the commissioning of new memory fabs. The substitution of GPUs with in-house ASICs acts on the opposite side of demand: it reduces the need for general-purpose accelerators regardless of token growth, adding a horizontal deformation to the whip — GPU orders can fall even while inference grows. The network layer will react with a lag, but in the same direction. Thus the 2027 inflection will arrive not only in memory: the simultaneous easing of packaging constraints, the substitution of rentals with in-house chips, and the HBM surplus will combine into a single surplus impulse, which the accelerator market will survive worse than the model market.
5.4. The 2027 inflection point: the cliff effect
The main macro-risk of this section is the synchronization of capacity commissioning. In late 2026 — first half of 2027, the new SK Hynix lines, Samsung's expanded capacity and Micron's fabs in Taiwan and the US all come online at full strength simultaneously. If a slowdown of hyperscaler capex growth lands in that window — against post-IPO repricing of AI startups and API margin compression — a cliff effect (capacity cliff) ensues: instantly freed HBM wafers redirect to DDR5 and GDDR7 output, and the memory market travels the path from severe shortage to historic surplus within a few quarters. Precedents of that scale are the memory crashes of 2001 and 2008, when prices fell 60–80% in a year.
For the article's main drama, the side effect matters: a memory crash is a subsidy for local inference. Cheap DDR5 and GDDR7 make workstations and servers for open models cheaper exactly when the quality of those models catches up with the frontier of 6–9 months ago. The bullwhip, discharging in hardware, turns out to be an amplifier of the democratization described in Section 7: the cycle that presses the closed labs from above with the hyperscalers' price war presses them from below too — by cheapening the alternative infrastructure.
6. IPO timing: the exit window against the depreciation wall
6.1. Dates and the mechanics of exit liquidity
The exit window is pinned with precision. OpenAI confidentially filed its preliminary S-1 on May 22, 2026 (leads — Goldman Sachs, Morgan Stanley and JPMorgan), public registration followed in September, the final prospectus (424B4) disclosed half-year financials on EDGAR, and the listing is set for October. Anthropic has also passed the confidential stage: $965 billion is the post-money secondary-market mark, not a public target, which requires verification; the listing, per press reports, is planned for October 2026. The two largest listings of the sector concentrated in one month is not a coincidence but investor logic: venture funds with matured fund lives lock in the paper valuation while the window is open, and transfer the risk of the continuing price war from the private market to retail and index investors. In the classic vocabulary this is exit liquidity — the liquidity of exit, provided by the arrival of a new class of holders with a different horizon and different access to information.
The exit window opens at the moment passive strategies are already overloaded with AI exposure. The top 10 of the S&P 500 control about 40% of index capitalization (the fifth timer, Section 1.2), so a fund obliged to buy OpenAI or Anthropic shares upon their inclusion in the S&P 500 or Nasdaq-100 must simultaneously sell part of its existing AI positions — the very ones already sitting in the portfolio through NVIDIA, Microsoft, Alphabet and Amazon. The absorption capacity of passive demand is limited not by the market's size but by its concentration: the higher the top-10 share, the less free "weight" remains for a new trillion-dollar listing.
The second constraint is alternative return. An institutional allocator choosing between buying a negative-margin lab's stock and a 30-year paper with a guaranteed 5.5% coupon votes for the second — until the multiple falls to a level at which the cash flow becomes real. This does not preclude a successful first trading day: retail demand and narrative can produce a spike. But it does preclude durable price support once the retail impulse is spent and trading on fundamentals begins.
Table 3. Key dates of the IPO window and related events (as of 30.09.2026)
| Company / event | Status | Date / term |
|---|---|---|
| Public S-1 / 424B4 prospectus — the first verification event | registered; margin, loss, revenue concentration disclosed | September 2026, SEC EDGAR |
| OpenAI — confidential S-1 | filed, lead banks confirmed | May 22, 2026 |
| OpenAI — public registration | done; 424B4 prospectus on EDGAR | September 2026 |
| OpenAI — listing | on track | October 2026 |
| Anthropic — S-1 and valuation | $965 B — post-money secondary mark; the target requires verification | listing — October 2026 (per press reports) |
| Employee lockup expiration | forecast | Q1–Q2 2027 (6 months after listing) |
| First public 10-Ks with GAAP audit | forecast | during 2027 |
| Anthropic — operating result for 2025 | operating loss $8.06 B vs $2.98 B a year earlier; net loss $42 B — mostly non-cash revaluation of convertibles (~$34 B); 2025 revenue — $4.6 B | full 2025 (Anthropic disclosures) |
| Anthropic — operating result Q2 2026 | second quarter with operating profit; breakeven visible | Q2 2026 |
| OpenAI — company guidance | loss ~$14 B for 2026; breakeven — 2029 | 2026–2029 |
| Project Jupiter (Oracle/Blue Owl) — force majeure | Oracle payment deferral; Energy Transfer moved to 01.02.2027; air-quality permit deadline 23.11.2026 | 24.09.2026 |
Sources: business press and corporate statements June–October 2026; the 424B4 prospectus (SEC EDGAR). The exact listing date and final valuation to be verified before publication.
6.2. The inevitability of the GAAP audit: NRR and the depreciation wall
Private reporting lives by management rules: bespoke metrics, arbitrary retention periods, "pro-forma" carve-outs from revenue. A public listing forces the company onto GAAP, and two quantities become truly visible for the first time. The first is net revenue retention: the share of last year's clients who kept and grew their spend. In enterprise, NRR above 110% justifies a 30x multiple; falling below 100% turns growing revenue into a sieve. The second is depreciation of the utilized equipment: GPUs bought in 2024–2025 at peak prices depreciate faster than the accounting schedule amid annual generation changes, and the auditor will have to recognize either a hidden loss or an unrealistic service life. The addition of these two disclosures forms the depreciation wall (D&A wall) of 2027: the moment the reporting shows the cycle's economy as it is, not as the round memorandums delivered it. In the event the calendar proved shorter: gross margin, NRR and depreciation policy were disclosed already in the 424B4 prospectus — the first real reading of the financials happened before the listing, not in the 2027 10-K.
Separate attention deserves the companies' behavior in the pre-sale phase. In the four weeks before listing, OpenAI moved its price grid three times — from the premium $50 at Astra to $10 at GPT-6.1 Sol — and Anthropic cut 20% off its flagship. Formally this works to grow volumes ahead of the revenue measurement in the prospectus; in fact it is a documented admission that the market's premium floor can no longer carry its own price. For an investor reading the prospectus, the signal is double: the revenue in it may be real, but the margin structure on which it grew is already obsolete.
Measurable data points instead of promises also came from Anthropic's full 2025 report. The key distinction, without which the numbers read wrongly: the $42 billion net loss is mostly a non-cash revaluation of convertible instruments (~$34 billion), an effect of revaluing obligations against a rising valuation; the substantive figure is an operating loss of $8.06 billion versus $2.98 billion a year earlier. Inside the operating line one sees where the cycle's money goes: $7.33 billion of compute expense is 58% of operating expenses and 1.6x the 2025 annual revenue ($4.6 billion). The concentration is concrete too: two clients at 12% of revenue each, without long-term contracts — not an abstract NRR but ready currency for the finite-budget trap of Section 8.5: a quarter of the bill hangs on two subscribers, each going through its own sequestration. The scenarios, meanwhile, are split by company: Anthropic, after the annual report, also showed a second quarter of 2026 with operating profit — its breakeven is visible to the naked eye; OpenAI's guidance is a loss of about $14 billion for 2026 with breakeven in 2029 — the longest road to payback among the listings.
Multiple compression hits not only the accounting but the labs' main asset — their people; the author calls this mechanism the talent death spiral. Much of top researchers' compensation is tied to RSUs valued on secondary markets near the top marks of the $150 billion – $1 trillion range (Section 1.1); a public repricing to "utility" multiples leaves options underwater — with a strike above the market price. Historically, golden handcuffs held talent for years; in the 2026–2027 cycle they will rust within one quarter after the lockups open (Q1–Q2 2027, Table 3). Next comes a migration wave: the best engineers leave for hyperscalers, who pay in live cash from operating cash flow, or build lean startups on open weights (Section 7). The acqui-hire mechanism of Section 2.3 closes its loop: in 2027, the labs' boards will be offered a sale to Big Tech not only by creditors but by their own employees demanding some liquidity for their options.
6.3. Historical parallels
The comparison with the dot-com IPO wave of 2000 is limited to a single quarter: hundreds of zero-revenue companies went public then; now it is two companies with revenue in the tens of billions. Closer in mechanics is the 2021 SPAC boom: there too, an asset with unproven margin was handed to the general public through a window opened precisely at the last moment of favorable conditions, and under a new-era narrative too. The common denominator of both waves — the public market took on risk at the point of the cycle's maximum valuation. The difference today is scale: we are talking about companies that after listing will, with high probability, enter the key indexes — that is, passive strategies will acquire the risk automatically, without any decision by the investor — and the absorption capacity of this channel is limited by the concentration of the index itself, as shown in Section 6.1.
7. The democratization of inference: hardware and local models
7.1. The iron cycle: the secondary market, modding and unified memory
Hardware democratization begins with the cycle of decommissioned accelerators. Mass corporate write-offs of A100s and H100s are rather a 2027–2028 story, when the transition to the Blackwell and Rubin generations frees the previous generation's fleets; already, broker markets offer these cards at a substantial discount to list price, and every warehouse top-up undermines the rental subscriptions of the neoclouds. In the consumer segment, modding has become a practice: reflashing and swapping memory modules allow raising VRAM on popular accelerators (typical cases — an A100 from 40 to 80 GB, consumer-card modifications up to 48 GB), and unified-memory workstations — Apple Silicon Ultra up to 128–256 GB, Strix Halo platforms with 128 GB, DGX Spark, MI300X-class accelerators with 192 GB — run local inference of models up to 70 billion parameters with no modding at all. The reader should note the precise distinction: 128–192 GB on the desktop is the reality of unified-memory platforms, not re-soldered consumer cards.
The link with Section 5 closes the mechanism: the 2027 capacity cliff will redirect wafers from HBM back to DDR5 and GDDR7, crashing ordinary-memory prices — and thereby cheapening precisely the category of hardware on which local inference lives. The bullwhip, painful for manufacturers, works as a mass subsidy for decentralization: the memory surplus born of the AI race will return to the market as cheap modules for machines depending on no single API.
7.2. Local models and the freshness premium
The software side of democratization is described by a single parameter — the lag between the frontier and open weights. In 2024 it was about 18 months; by 2026 it had shrunk to 6–9 months: the open DeepSeek, Qwen, GLM, Kimi and MiniMax families compete with the closed frontier of late 2025 — early 2026, and the publication cadence does not lag the commercial vendors. Open models are distilled from closed frontiers — literally trained on their outputs — turning the premium floor of closed APIs into a free training corpus for the alternative ecosystem. The author calls this the distillation pump: the more expensive the premium subscription, the stronger the economic incentive to reproduce its quality for free.
The dynamics' accelerant is the Chinese factor — the "DeepSeek effect". Working under strict export controls on fast accelerators, the Chinese teams — DeepSeek, Alibaba's Qwen, GLM, Kimi — squeezed architectural efficiency out of the sanctions: Multi-head Latent Attention (MLA) compresses the KV cache by multiples, sparse Mixture-of-Experts (MoE) activates a small share of parameters per token — together this is training and inference of frontier class on scarce hardware. By releasing such models into open access, China gives the market, for free, quality comparable to the closed US APIs — legal, self-hostable and independent of a vendor's sanctions moods. For the closed labs this is a double blow to NRR: the corporate buyer gets not an "abridged copy" but a full-fledged alternative to the premium floor, and the freshness premium is zeroed out from within. A sanctions regime designed as a brake on Chinese AI has turned out to be a subsidy for the open ecosystem.
Economically, the local ecosystem sets a price ceiling for the closed API — the shadow price. A rational corporate buyer compares the vendor's token price with the full cost of ownership of a self-hosted open model of comparable quality; the difference between them is the freshness premium — payment for the last two or three quarters of quality. As the lag compresses, the premium evaporates, and rational arbitrage splits the load: mass and price-sensitive workloads move to self-hosting; the API keeps frontier-exclusive tasks. The local-run stack — Ollama, llama.cpp, vLLM, MLX — already solves operations for an average corporate IT team, not only enthusiasts; the constraint is not technology but habit and accountability for a vendor contract.
8. The economics of overproduction: demand, supply and the margin scissors
8.1. Demand: agenticity and the Jevons paradox
The bullish half of the truth is that demand really is exponential. Agentic workloads consume one to two orders of magnitude more tokens per task than chat: planning, tool calls, retries, long contexts. Aggregate token consumption at the leaders is already measured in quadrillions per month, and Bloomberg Intelligence projects the generative-AI market to reach $2.3 trillion by 2032 — up to 22% of all technology spending. The classic Jevons paradox works: a falling price per unit of intelligence raises aggregate consumption faster than the unit gets cheaper. It would be a mistake to deny this mechanism; it would be equally a mistake to conclude eternal margin from it.
An architectural shift multiplies this demand by one more factor. The move from scaling training to scaling reasoning at call time — test-time compute — means that reasoning models (the o-series and GPT-6 reasoning at OpenAI, Gemini Thinking at Google) generate thousands of hidden chain-of-thought tokens per visible answer: the client never sees them but pays for the compute. Physically the load shifts from memory bandwidth to KV-cache capacity — long contexts and agentic sessions hold giant state tables in HBM, and it is capacity, not speed, that becomes the inference bottleneck. Economically a reasoning token costs the vendor an order of magnitude more than a chat token at an unchanged list price: every unit of quality progress in 2025–2026 was bought with cost. Jevons here works with leverage — agenticity multiplies reasoning, producing those very 10–100x per task.
8.2. Supply: the SKU explosion and open weights
Supply grows faster than paying premium demand through three channels. The first is the SKU explosion: every major vendor runs 4–8 active models with overlapping capabilities (Astra/Sol/Luna at OpenAI, Pro/Flash/Flash-Lite at Google, Opus/Sonnet/Haiku at Anthropic), and every new model at launch devalues its neighbors. The second is open weights, covering the middle quality tier for free. The third is capacity itself: the 2025–2026 capex race creates compute supply that physically must be sold as tokens, or it amortizes into loss. The sum of the three channels is a market in which every unit of quality has several sellers, and the buyer gains growing negotiating power.
In this split, open weights are reinforced by the Chinese channel (Section 7.2): quality described back in 2025 as "the frontier of a year ago" is, by 2026, covered by DeepSeek, Qwen, GLM and Kimi models, available free and modifiable. Enterprise integrators increasingly put open-weights into the procurement baseline as a sanctions-resilient and auditable alternative, and open-model vendors compete among themselves on architectural efficiency (MLA, MoE), not API price. As a result the mid tier has ceased to be the closed labs' profit zone: the self-host shadow price already operates there, and every week of lag compression shifts the boundary one more class of tasks upward.
8.3. The price scissors: documentation within one week
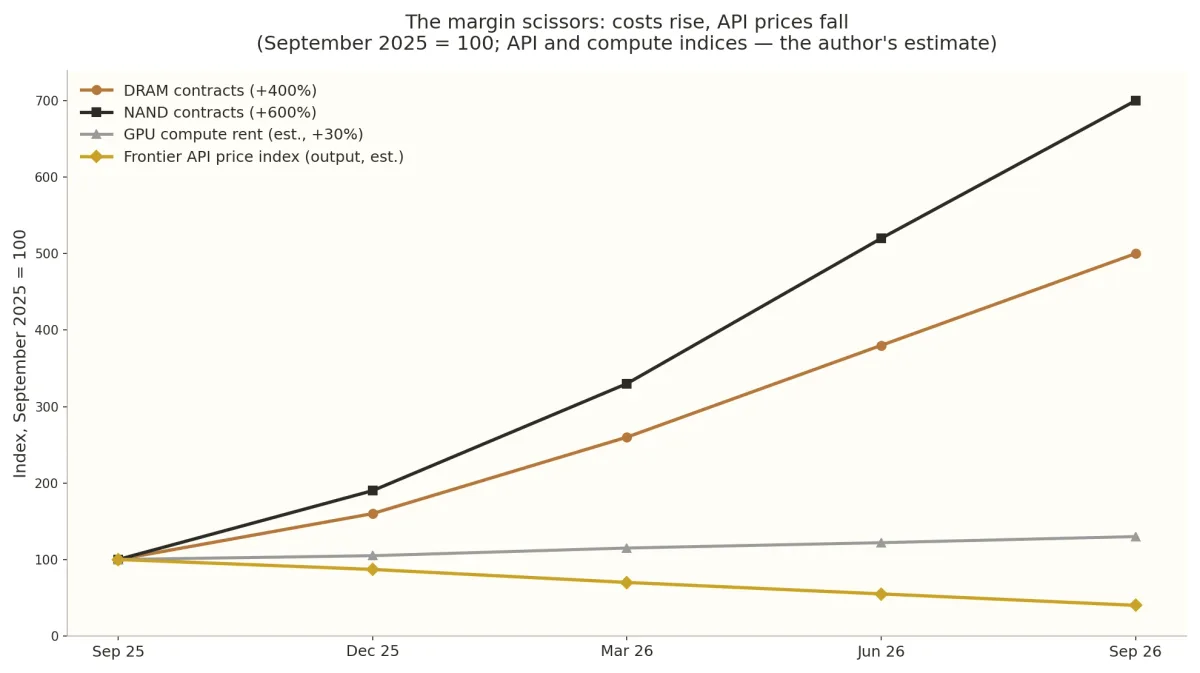
The chronology of the last week of September 2026 is the best illustration of the section an analyst could wish for. On September 3, OpenAI ships GPT-6 Astra at $10/$50 — the premium floor holds. On September 22, Sol and Luna arrive with a 50% price cut, and Anthropic answers the same day with Opus 5.5 at −20%. On September 29, GPT-6.1 Sol lands — the line's new bottom tier, at one fifth of the flagship's price. In 26 days, the price of a unit of frontier intelligence in the mid tier fell by multiples, while contract DRAM was rising 400%, NAND 600%, and GPU rental climbing since spring. Prices are squeezed from both sides at once, and both blades of the scissors are publicly documented (Fig. 4). One caveat is mandatory: the week's price comparison is complicated by an SKU change — Sol is a lower-class product with its own, lower cost base, and its price does not equal flagship-quality pricing; the only clean single-SKU cut in this chronology is Opus 5.5 versus the discontinued Opus 5 (−20%). Figure 4 therefore speaks about prices, not margin: the bridge from prices to margin is the prospectus alone (Section 6.2).
8.4. The Jevons split: why growing revenue does not save the multiple
The key distinction for the forecast: the Jevons paradox guarantees aggregate revenue growth, but multiples are priced not on revenue but on margin and its trajectory. P/S 30x requires not just growth but dollar profit growing faster than revenue — that is, gross-margin expansion. The scissors deliver the opposite: the cost share (silicon, memory, energy) of the token price is rising, and the competitive structure of the market does not allow a premium to be held for more than one quarter between releases. The result reads: revenue up, margin down, the multiple down faster than revenue. This is compression without death — the base case for public labs, in which the business keeps growing while the valuation loses 65–85% relative to listing (the anchor of the listing discount — the note to Table 4). Exactly this mechanism killed, in 2000–2002, not internet companies as a class but their valuations.
Revenue up, margin down, the multiple down faster than revenue. That is how, in 2000–2002, internet companies' valuations died — not the companies.
A separate compression channel is the flat-rate trap. Fixed $20–30 monthly plans were designed for a chat consumption profile; an autonomous agent on a reasoning model consumes two orders of magnitude more tokens, and the subscription segment's margin turns deeply negative: the more active the client, the faster the vendor's loss grows. The labs' answer — limits, overages and the move to outcome-based pricing, payment per result — sits badly with corporate budgets: an IT department needs a predictable bill, not a percentage of closed tickets, which creates an adoption barrier for enterprise clients. This barrier slows the monetization of the agentic wave exactly when it was supposed to save the margin, and adds a third blade to the scissors — after API prices and hardware cost.
The hidden multiplier the bullish agentic narrative of Section 8.1 misses is the reliability tax. Everyone counts tokens; nobody counts errors. In enterprise the tolerated hallucination rate tends to zero while LLMs are probabilistic by nature; to get a deterministic result the agentic architecture must insure itself: Generator–Judge patterns (a generator with an independent verifier), parallel reasoning chains with voting (tree-of-thought), automated result checks. In practice one successfully closed task in a reliable loop consumes 30–50 times more tokens than the same run without hallucination insurance (the author's estimate) — a surcharge on top of the already counted 10–100x of agenticity and reasoning; on top comes the cost of human-in-the-loop — the salaries of operators sorting out dead-end branches. The Jevons paradox works — but multiplies not useful work but computational waste. To a CFO this looks like exploding API bills against stagnant labor productivity — arithmetic that leads to a sequestration of "experimental" AI budgets in the second half of 2027.
8.5. The deflationary trap: efficiency versus productivity
The bullish narrative rests on an axiom: AI will create trillions of dollars of new economic value. But look into the CFO decks of 2024–2026 and "value" means not creating new markets (productivity) but cutting costs (efficiency). The AI supercycle is not a boom of new GDP but a massive deflationary shock to white-collar labor. The distinction is fundamental: productivity — like electrification or the internet — creates new professions, markets and demand, and the money returns into the economy, feeding the Jevons paradox; efficiency — like assembly-line automation — makes the same volume of work with fewer people, and the gain settles in corporate margins and vendor revenue, not in consumers' pockets.
For the closed labs this creates the finite-budget trap (Cost Center Trap). The corporate buyer treats the API not as an investment in growth (Revenue Center) but as a cost-optimization line (Cost Center): the AI budget is hard-tied to the payroll the company plans to shrink. As soon as a bank, consultancy or IT giant reaches its headcount-reduction target — say, replacing a tenth of its junior analysts with agents — the motivation to grow token consumption evaporates. Efficiency has a hard mathematical ceiling: headcount cannot be cut below zero. The competition of Anthropic, OpenAI and Google becomes a zero-sum game over the finite pool of money corporations have allocated to replacing their own employees; when the first wave of automation of 2024–2026 passes, NRR falls below 100% — the client is already "optimized" and needs no new model versions to maintain the achieved level.
The second blow — to the B2C segment — is real but secondary relative to the API channel: the $20–30 monthly subscription is already loss-making under agentic consumption (Section 8.4), and the stagnation of middle-class incomes and the hiring freeze make it the first line of sequestration. The core of the labs' monetization is the enterprise API, so the blow to subscriptions compresses the perimeter but does not decide the outcome; nevertheless, AI built to replace the average coder or copywriter deprives itself of a paying user here too.
Here lies the answer to why the Jevons paradox (Section 8.1) may fail. The paradox has a hidden condition the bullish narrative usually forgets: the savings must return into the economy through consumption. The classic chain has four links: the resource gets cheaper; its use becomes more efficient; the freed money does not pool with the saver but is spent on new goods and services; that new consumption creates derived demand for the same resource. Aggregate consumption grows not because the resource got cheaper but because the savings recycled through the market. Remove the return link and the paradox flips: the cheapening resource gains no new demand — it simply loses consumers.
In the "AI-as-efficiency" model the return link is absent — the whole section rests on this. The corporate buyer's savings are, first of all, a shrunken payroll, and the laid-off money does not return into consumption: its carriers have exited the demand economy rather than redistributing within it. The remaining question: where does the saving go? There are two channels, and the first is Big Tech buybacks. This is financial recirculation: the money flows into the equity market, not into goods and services, and creates no derived demand for compute.
The second channel — GPU capex (Section 4) — looks promising: it seems this is exactly the missing Jevons link. The saving is spent, demand for compute has grown. But this channel is not a leak and not independent demand; it is derived, and it has three properties the classic Jevonian recycle lacks.
The first is concentration. The buyers are four or five hyperscalers, not millions of new consumers: between the corporate budget and the GPU stands a handful of intermediaries, and the whole end market compresses into a few procurement decisions.
The second is a shared budget with the savings. The capex channel and payroll cuts are not two independent flows but the same corporate cash pool. GPU demand exists exactly as long as the CFO believes the payroll savings justify it.
The third is a finite end demand. The channel serves the supply of tokens whose ceiling is set by the finite-budget trap (Cost Center Trap) of this same section: tokens are not a standalone product but a line item, and its size is set by the customer's budget, not the developer's ingenuity.
From the three properties emerges a double-lever dynamic. While the budget expands, the "savings → capex" recycle inflates purchases beyond end demand — this is how the bullwhip of Section 4 gains altitude. At the first sequestration — the first CFO who saw no payback and cut the AI budget — the capex channel collapses with the budget, because it fed on it. In the downturn both levers fire at once: the derived capex demand disappears, and the end demand, already undercut by headcount cuts, compensates nothing. Where classic Jevons produced self-sustaining expansion, here it produces self-sustaining compression.
The loop closes with a minus sign: AI destroys the purchasing power of the very class that was supposed to pay for its next generation. The recycle creates no new demand — it displaces the old.
Here the finite-budget trap takes its name from the epigraph. This cycle's Bolivar — the finite pool of corporate money tied to shrinking payrolls; it carries more riders than it can bear: hyperscaler buyers, developers, the debt market, buyback shareholders. The only question is who dismounts first — and who gets the saddle.
9. Conclusions and the market forecast
9.1. Three scenarios
The summary of the forecast — three scenarios with the author's probabilities (Table 4, Fig. 5). The common frame across all three: the October listing succeeds, because the window is already open and the alternative was not exiting at all; divergence begins in 2027, when the financials first show real margin and the memory market reaches its inflection. The fifth timer — macro-gravity (Section 1.2) — does not change this frame but compresses it: an expensive risk-free rate and a fragile index determine not the success of the first trading day but the durability of price support once the retail impulse is spent (Section 6.1). The deflationary trap (Section 8.5) additionally weighs on the bull case: an "efficiency" instead of "productivity" regime caps the very pool of corporate AI budgets, turning market growth into a zero-sum game. The financials and guidances have already split the base case by company: Anthropic's breakeven is visible in its Q2 report; OpenAI's guidance pushes breakeven to 2029 (Section 6.2) — different trajectories within one probability frame.
Table 4. Scenarios for 2027 (the author's probability estimates)
| Scenario | Probability | P/S by 2027 | Mechanics | Triggers |
|---|---|---|---|---|
| Base: compression without death | ≈55% | 3–5x | Revenue grows on Jevons, gross margin falls with the scissors; Google takes API share; the labs remain public commodity players with enterprise contracts; after the first headcount-substitution phase (FTE substitution), AI budgets stabilize as a predictable but low-margin "utility" growing 10–15% a year — mathematically incompatible with P/S 30x | Gemini 4 Pro priced no higher than the leader's cheap line (~$10 at cutoff) within the listing window; the four observables of 3.3; NRR 105–115% in the first 10-Ks |
| Bear: restructurings | ≈25% | 1–2x | The scissors coincide with the capacity cliff and a CapEx turn; loss-making operations + the depreciation wall; sales, changes of control, acqui-hires per the precedents of Section 2 | NRR <100%; auditors revising depreciation lives; used-H100 spot below $1.5/hour |
| Bull: Jevons beats the scissors | ≈20% | 12–15x | Agentic workloads monetize above cost; enterprise NRR holds >120%; Google moves the attack to the Flash segment, the premium survives | Lab revenue growth >100% y/y at stable gross margin; the capacity shortage persists into 2027 |
Note to Table 4. The P/S base is a consensus forward on revenue; the private anchor is marks around 30x on an ARR of ~$65 B. The public market prices entry with a listing discount: for companies with negative margin the typical entry is 15–20x instead of 30x. From the listing entry, the base branch of 3–5x implies minus 67–85%, the bull 12–15x minus 0–25%, the bear 1–2x minus 87–95%; every branch describes compression from the private valuation, because the private valuation, per the text's thesis, is the anomaly — hence the "bull" here is the best outcome within a bearish spectrum, not growth.
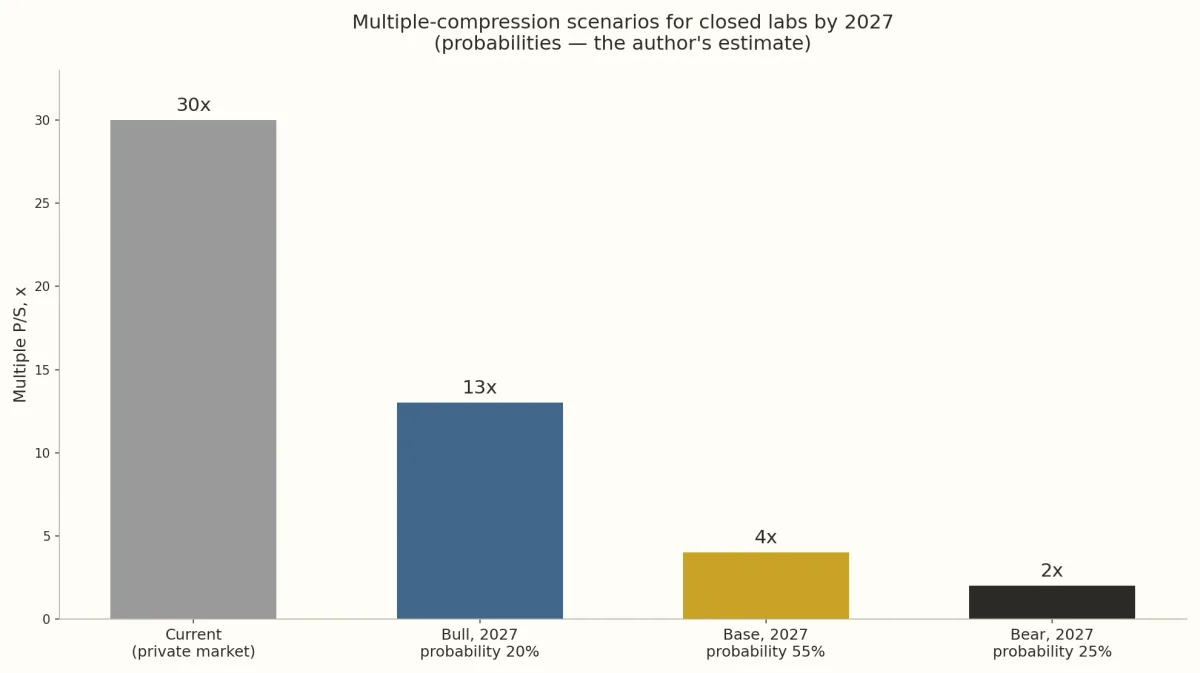
9.2. The dashboard of leading indicators
The value of an analytical text is determined by whether it can be checked. The dashboard below fixes nineteen measurable indicators with the places to observe them; scenario reviews are proposed every six months — the next checkpoint: March 2027.
Table 5. The dashboard of leading indicators
| Indicator | What it signals | Where to watch |
|---|---|---|
| The four distinguishing criteria of hypothesis 3.3 | A softening of Google's capex guidance, bundling the Gemini 4 Pro tariff with distribution, synchronizing the launch with the listing window, preserving its own premium floor: fulfillment predicts the strategic "landlord" version | Alphabet reports (capex guidance), the Google blog, the Gemini/Vertex API price list |
| Big-four 2027 capex guidance | A slowdown is the first bell of the hardware bullwhip | Quarterly reports of Microsoft, Alphabet, Amazon, Meta |
| HBM order books and DRAM contract quotes | A turn in memory inflation — the prologue to the capacity cliff | TrendForce, industry press, SK Hynix/Samsung/Micron reports |
| Spot prices for used A100/H100/L40S | The start of the iron cycle and pressure on neocloud rentals | Secondary GPU-market broker platforms |
| Gross margin: 424B4 → Q3 → first 10-Ks | The prospectus gave 56 cents on the dollar (71 a year earlier); September's discounts are not reflected in Q2 — the clean margin test is the Q3 report; NRR — in the first 10-K | SEC EDGAR (424B4), post-listing quarterly reports |
| Depreciation policy and RPO in the 424B4 | The depreciation wall first becomes visible in the disclosure of server service lives — earlier than any 10-K | SEC EDGAR (424B4) |
| RPO and credit spreads of Oracle/CoreWeave; the Project Jupiter calendar | The health of the circular economy; moved dates: Energy Transfer to 01.02.2027, air-quality permit deadline 23.11.2026, project-debt spreads (~$18 B, paper near 89 cents) | Oracle reporting, CDS spreads, FT and industry press, the CoreWeave report |
| Private-credit rates and volumes in data centers | The cycle's hidden leverage: SPV stress is visible before public defaults | Private-debt fund reports, Blue Owl-type deals |
| Labs' revenue concentration (share of the two largest clients) | The currency of the finite-budget trap (8.5): two clients at 12% each without long-term contracts — a quarter of the bill is first to be reviewed under sequestration | Anthropic disclosures, the 424B4 prospectus, the labs' first 10-Ks |
| Open-weights share on OpenRouter | The speed of bottom-up commoditization of the premium floor | OpenRouter weekly statistics |
| CoWoS expansion volumes at TSMC | Easing the physical "bottleneck" of chip output — the prologue to accelerator surplus | TSMC reports, TrendForce analytics |
| Power-transformer lead times and liquid-cooling retrofits | The physical capex ceiling: without power transformers (queues 100+ weeks) and 120+ kW rack cooling (Blackwell/Rubin), data centers are not commissioned at any price; lengthening queues are a direct brake on the cycle | Eaton, Vertiv, Schneider Electric reports; industry lead-time analytics |
| Share of in-house ASICs in Big Tech inference | The pace of cost reduction at the hyperscalers (TPU, Trainium, Maia) and pressure on GPU rentals | Microsoft, Amazon, Meta, Alphabet reports |
| Share of Test-Time Compute (reasoning) in workloads | Rising per-task token consumption and KV-cache pressure — accelerating the price scissors | OpenRouter statistics, lab reports |
| Synthetic vs human-data quality divergence on edge-case benchmarks | Confirmation of thesis 4.5: falling metrics on rare scenarios and long chains in open domains proves epistemic drift and the impossibility of engineering around the "data tax" | Academic preprints (arXiv), AI-safety institute reports, enterprise benchmarks |
| UST 10Y/30Y yields and the curve shape | A rising risk-free rate breaks the labs' DCF models at P/S 30x and raises rollover costs for neoclouds and SPVs; current levels 10Y = 5.24% (two basis points below the 2007 close), 30Y = 5.56% — highs since 2007 | FRED (DGS10, DGS30), U.S. Treasury, CME Group |
| S&P 500 concentration (top-10 share) and market breadth | Market narrowness — 40% for the top 10 against a 19–21% norm and a 27% dot-com peak — makes the index fragile; narrowing breadth on a rising index is an early reversal signal | S&P Dow Jones Indices, Yardeni Research, Bloomberg |
| High Yield spreads (HY OAS) and IG credit spreads | Widening spreads mean the market is pricing defaults into project financing and neoclouds before they become public | FRED (BAMLH0A0HYM2), ICE BofA Indices |
| White-collar hiring and wage dynamics (Tech, Prof. Services, Finance) | Testing thesis 8.5: junior/mid vacancy stagnation against growing lab revenue proves the "efficiency" rather than "productivity" regime; falling incomes hit B2C conversion and cap B2B budgets | BLS JOLTS, LinkedIn Economic Graph, Indeed Wage Tracker |
9.3. How the text will be tested
The landlord hypothesis will be tested before everything else: the four distinguishing criteria of 3.3 — guidance, tariff, window, premium floor — either materialize or not, and this alone will decide the hypothesis's fate before the market forms a consensus. The broader frame — the vise between the hyperscalers and cost — will be tested more slowly but no less surely: the 424B4 prospectus has already delivered the first margin data point, Q3 reporting will show the trajectory, the labs' first 10-Ks in 2027 will fix NRR and depreciation, the memory reports will decide the capacity cliff, and the nineteen-indicator dashboard gives the observer a six-month head start on consensus. The end of the closed-API era, should it come, will look not like an explosion but like suffocation: quarter after quarter of falling margin on rising revenue — and at that moment value will shift to where it always flows at the end of infrastructure cycles: to the owners of physical infrastructure in the boom phase, and to the users of cheap infrastructure in the bust phase.
9.4. Why this text may be wrong
A bearish thesis must carry its own refutation mechanism — otherwise it turns into faith. Below are four grounds on which this text may prove wrong, in descending order of probability; each has its own indicator in the dashboard. An honest list here works harder than caveats in footnotes: it sets the boundaries within which the scenarios of Section 9 make sense, and shows which observations should make the reader close this text with the conclusion "the author was wrong".
The first and most unpleasant ground: right on substance, wrong on timing. Every cycle of this genre did end in compression — but the timing the text bets on (2027 as the point of maximum tension) may prove too early. If Q3 reporting shows margin recovery, September's discounts remain a one-off correction, and all four hyperscalers raise their 2027 capex guidance again, the cycle will keep expanding for another year or two. In that world there is no crisis at all: the infrastructure — power companies, builders, lenders, memory makers — slowly takes the value through prices and interest, the labs do not collapse but dissolve, and every scenario of Section 9 turns out to be an answer to the wrong question: not "when will it burst" but "for how many years will it leak". Indicator: Q3–Q4 margin and big-four 2027 guidance — if all four raise plans, the timing shifts.
The second ground — absorption instead of collapse. The closed labs' valuations may not "burst" but dissolve into buyers' balance sheets: hyperscalers and sovereign funds can absorb stress through acqui-hire deals, project recapitalizations and JWCC-type contracts (Section 2.4) faster than the market can run a public repricing. The bear case then plays out as a change of owners without a crisis scene — and the text's conclusions prove right in mechanism but wrong in dramaturgy. Indicator: the share of acquisitions and acqui-hires in sector exits versus IPOs in 2027.
The third ground — cost may fall faster than prices. The market itself has presented the counterexample: Sol at one fifth of the flagship's price is a lower-class product whose cost may have fallen even further (Section 8.3). If the new silicon generations (TPU v7/v8, Rubin) and post-cliff cheap memory close the scissors from the cost side, margin will recover on growing volumes — and the multiples will hold. This is the most technical of the threats: it requires watching not prices but which side of the scissors moves faster. Indicator: gross margin in Q3–Q4 after the new silicon generations versus the API price trajectory.
The fourth ground: the correct diagnosis may be made of the wrong object. The text describes the cycle of the closed labs, but the pool of money that decides the outcome is the hyperscalers' balance sheets: their advertising-and-cloud cash flow can fund the deficit longer than any bear scenario's patience — that is how AT&T-class operators survived 2001 while their customer base did not. If prices keep living on the balance of four corporations, the "bubble" will exist exactly as long as they want to fund it. Indicator: big-four free cash flow versus AI capex and their bond spreads.
Sources, assumptions and glossary
Below is the recorded verification status of the text's key claims. The category "confirmed" means the existence of public reports or corporate announcements as of the September 30, 2026 cutoff; "author's estimate" — calculated or expert values for which the author is responsible; "requires verification" — facts found in single sources and to be verified before publication of the final version.
Table 6. Status of key claims
| Claim | Status | Basis |
|---|---|---|
| OpenAI: S-1 filed 22.05.2026, listing in October | confirmed | corporate statement, business press (June–August 2026) |
| Anthropic: $965 B mark (post-money round); listing target — October | confirmed (round) / target requires verification | secondary market; business press 2026 |
| GPT-6 Astra $10/$50, 03.09.2026 | confirmed | several independent sources |
| GPT-6.1 Sol ~1/5 of Astra price, 29.09.2026 | confirmed | official OpenAI announcement; exact pricing requires verification |
| Claude Opus 5.5 $4/$20 (−20%), 22.09.2026 | confirmed | several independent sources |
| Gemini 3.1 Pro $2/$12, February 2026 | confirmed | price lists and reviews |
| Gemini 4 in post-training; date not announced | confirmed | industry publications (August 2026) |
| DRAM +400% / NAND +600% since late September 2025 | confirmed | industry contract-price summary (September 2026) |
| Opus 5 share over 30% of OpenRouter tokens | requires verification | podcast source (2026) |
| Compute rent rising April–August 2026 | requires verification | analytical source (2026) |
| Amazon: 2026 cash capex → $220 B | confirmed | corporate statement |
| SK Hynix: multiple DRAM output increase in 2026, M15X, Yongin | confirmed / details require verification | corporate announcements; volume details per press |
| Circular deals of Table 1 (NVIDIA–OpenAI, Oracle, AMD, Blue Owl, CoreWeave) | confirmed / volumes partly per press | corporate announcements and business press 2025–2026 |
| OpenAI/Anthropic valuations $150 B – $1+ T | confirmed (range) | secondary market, round reports |
| Cumulative capex/revenue gap $4+ T (2025–2028) | author's estimate; trajectory extrapolation, not a sum of components | methodology and caveat in Section 4.1 |
| Rent of physical infrastructure: two-thirds to four-fifths of the cycle's investment | author's estimate | qualitative value waterfall; Section 4.1 |
| Scenario probabilities 55/25/20 and P/S targets | author's estimate | Section 9 |
| Hypothesis 3.3 "landlord": four distinguishing observables | author's judgment | Section 3.3; dashboard |
| TPU v6 Trillium / v7 / v8 generations: Google inference on in-house silicon | confirmed / details require verification | Google corporate announcements, industry publications |
| Hyperscaler ASICs: −30–50% inference cost vs GPU | industry estimate | Trainium/MTIA/Maia analytics |
| CoWoS — the main limiter of accelerator output; networks — up to 15–20% of DC cost | confirmed (limiter) / estimate (share) | TSMC supply-chain analytics |
| MLA/MoE architectures of Chinese open models | confirmed | technical reports of DeepSeek/Qwen/GLM/Kimi |
| Flat-rate trap and the move to outcome-based pricing | author's estimate | Section 8.4 |
| UST 10Y = 5.24% — two basis points below the 2007 close; UST 30Y broke 5.56% (high since 2007) | confirmed | U.S. Treasury, FRED, CME Group data as of 30.09.2026 |
| Top-10 of S&P 500 ≈ 40% of capitalization; norm 19–21%; dot-com peak ≈ 27%; level unseen since the mid-1960s | confirmed | S&P Global, RBC Wealth Management, Common Fund, S&P DJI |
| Rights-holder lawsuits (NYT, Getty) and lab licensing deals (News Corp, Reddit, FT) | confirmed / case outcomes require verification | court documents, corporate announcements 2024–2026 |
| Sovereign funds (MGX, PIF/Humain) as a new capital class of AI infrastructure | confirmed / details require verification | corporate announcements, business press 2024–2026 |
| Power-transformer lead times 100+ weeks; 120+ kW racks require cooling retrofits | confirmed (range) | industry analytics; Eaton, Vertiv, Schneider Electric reports |
| Model collapse when training a model on its own outputs | confirmed (academically) | Nature / arXiv (Shumailov et al.) |
| Reliability surcharge: 30–50x tokens per verified task | author's estimate | Section 8.4 |
| Cost Center Trap: AI budgets tied to FTE cuts | author's estimate | Section 8.5 |
| Talent death spiral: underwater RSUs after lockup openings | author's estimate | Section 6.2 |
| Project Jupiter force majeure 24.09.2026: Blue Owl notice; Energy Transfer to 01.02.2027; air-permit deadline 23.11; Oracle payment deferral; project paper near 89 cents | confirmed / details per press | Reuters, TechCrunch, ENR, FT (September 2026) |
| Anthropic, full 2025: operating loss $8.06 B vs $2.98 B a year earlier; net loss $42 B with non-cash convertible revaluation ~$34 B; $7.33 B on compute = 58% of OpEx; 2025 revenue — $4.6 B | confirmed (Anthropic disclosures) | Anthropic disclosures; Section 6.2 |
| Prospectus gross margin: 71 → 56 cents on the dollar; September discounts not reflected in Q2; clean test — Q3 | confirmed (prospectus) / trajectory — author's estimate | SEC EDGAR; Section 6.2 |
| Anthropic: operating profit Q2 2026; ARR ~$65 B (August 2026) | confirmed / details require verification | business press, industry analytics (August 2026) |
| OpenAI: guidance of a ~$14 B loss for 2026; breakeven — 2029 | confirmed (company guidance) | business press (June–August 2026) |
| P/S sensitivity: 15x/31x/10x/5x at anchors of $965 B and $2 T | author's calculation on public anchors | Section 1.1 |
| Anthropic's future cloud-and-compute obligations ($518 B) versus her cash ($20.28 B) = 25.5x | confirmed (Anthropic disclosures); comparison — the author's | Section 4.1 |
| Top-10 S&P 500 profit share ≈ 34% | estimate; methodology to be fixed | consensus data FactSet/S&P; Section 1.2 |
| JWCC: $9 B defense contract (AWS, Google, Microsoft, Oracle) | confirmed | DoD; FTC 6(b) report |
| Lucent/Nortel vendor financing 1999–2000; Nortel: C$398 B (09.2000) → <C$5 B (08.2002), bankruptcy 2009; Lucent: $4.5 B loan (02.2001) | confirmed (historical reporting) | SEC filings, business press 2000–2009 |
| Bartz v. Anthropic: ~$1.5 B settlement for ~465 thousand works | confirmed / requires procedural completion | court documents (2025) |
| Rumored Gemini 4 Pro prices ($2.25/$11.25 – $3/$12) | requires verification | single press reports (September 2026) |
| Epigraph: "It's not agreeable to have to say this, but there is only room for one. Bolivar can't carry two" — Shark Dodson's final line in "The Roads We Choose" (O. Henry, 1910) | the line is confirmed against the story text (electronic publications); the Russian translation attribution — per the edition; translation rights to be verified before publication | O. Henry. Collected Works in 3 vols. Vol. 3. Moscow: Pravda, 1975; the term "Bolivar" — Table 7 |
Table 7. Glossary
| Term | Meaning |
|---|---|
| P/S | The "capitalization / annual revenue" multiple |
| NRR | Net revenue retention — the kept and expanded revenue of last year's client cohort |
| RPO | Remaining performance obligations — the supplier's fixed outstanding contract obligations |
| Take-or-pay | A contract where payment is due regardless of actual usage volume |
| GAAP / 10-K | US financial-reporting standards and the issuer's annual report under them |
| D&A wall | A jump in depreciation charges upon reassessment of equipment service lives |
| HBM | High Bandwidth Memory — stacked accelerator memory; wafer consumption triple that of DDR5 |
| TSV | Through-silicon vias — the technology of vertical HBM die stacking |
| Bullwhip effect | Amplification of order swings moving upstream in the supply chain |
| Capacity cliff | Sharp market oversupply when synchronized capacity meets slowing demand |
| SPV / private credit | A project company off the initiator's balance sheet; private debt as its funding source |
| Lockups | The ban on employees selling shares for ~6 months after IPO |
| Shadow price | The modeled alternative cost of a self-hosted open model for comparison with an API |
| Commoditize your complement | The strategy of devaluing the adjacent layer of the chain while capturing value in one's own |
| CoWoS | Chip-on-Wafer-on-Substrate — TSMC's 3D packaging combining the logic die and HBM stacks; the key limiter of accelerator output |
| KV cache | Attention-state memory: stores intermediate context representations; capacity determines session length and reasoning cost |
| Test-time compute | Scaling reasoning at call time: the model generates thousands of hidden chain-of-thought tokens before answering |
| Flat-rate trap | The unprofitability of fixed subscriptions under agentic token consumption orders of magnitude above chat |
| Outcome-based pricing | Payment per task result instead of per-token tariffs or subscriptions |
| MoE / MLA | Mixture-of-Experts — sparse activation of a share of parameters; Multi-head Latent Attention — KV-cache compression; compute- and memory-saving architectures |
| Asset-backed loan | A loan against equipment (GPU) collateral: collateral value falls with the accelerators' market price |
| Market breadth | The share of index stocks trading above key moving averages; narrowing breadth on a rising index — a classic reversal precursor |
| Term premium | The extra yield of long bonds over expected short rates; growth reflects fiscal risk and inflation uncertainty |
| Duration | The sensitivity of an asset's price to interest-rate change: price change ≈ duration × rate change; for long-duration assets with cash flows beyond a seven-year horizon, effective duration reaches 17–23 |
| Model collapse | Informational autophagy: model degradation when training on its own or model outputs; loss of variance and "collapse" of the probability distribution |
| Epistemic drift | The accumulation of hidden errors and erosion of rare scenarios in models fine-tuned on synthetics, from losing touch with changing reality |
| Tail events | Edge scenarios: rare but critically important exceptions that are washed out of synthetic datasets yet determine AI's value in enterprise environments |
| Ground truth | Objectively verifiable truth (a code-compilation or equation-solving result), necessary for a closed synthetic-training loop; exists only in formalizable domains |
| Bolivar | The finite pool of corporate AI budgets tied to shrinking payrolls; the image — from the epigraph (O. Henry) and Section 8.5 |
| Landlord | The frame of hypothesis 3.3: a silicon owner earning rent on other companies' models while its own fails to pay off per token |
| Vendor financing | A supplier's loan to a buyer of its own equipment (Lucent/Nortel, 1999–2000): someone else's demand is capitalized as the vendor's future revenue |
| 424B4 | The final US listing prospectus: discloses the company's financials before trading begins |
| JWCC | Joint Warfighting Cloud Capability — the Pentagon's $9 B defense cloud contract (AWS, Google, Microsoft, Oracle) |