
The country of cash pots: who controls France's money
Social partners, associations and state companies: who controls the shared money and who checks how it is spent.
Key points
In France, public money does not flow only through the central budget. Social insurance, local authorities, paritarian funds, state operators and non-state bodies tasked with public services all take part.
French unions have relatively few members, yet collective agreements cover almost all workers. So the social partners' influence cannot be judged by the size of their rank and file.
The AGFPN fund received €158.2m in 2025. About 77% of its money came from mandatory employer contributions, about 22% from the state budget. The organisations that run the fund are themselves among the recipients.
The Cour des comptes found AGFPN's spending controls inadequate. The fund later reported that most recipients had submitted reports, but paperwork is not the same as an independent check of every transaction.
State support for associations is put at €8bn counting only direct subsidies, and at €16bn on a broader measure. The gap exists because the second figure includes tax breaks and employment support.
These mechanisms do not explain France's deficit. Their significance lies elsewhere: they show how the distribution of money is set up, and how well society can check what happened after the funds moved.
Introduction. Not one cash pot
The French state raises and spends money through a multitude of organisations. Some of it flows through the central budget, some through social insurance and local authorities. There are state companies and agencies, paritarian funds, associations and private bodies handed public duties.
Every such recipient has its own rules. Some must publish detailed reports; others disclose only the minimum the law requires. In some cases spending is audited by the Cour des comptes, in others by an auditor the organisation hired itself. Sometimes the data exists but is scattered across documents and does not add up to a clear picture.
So the article's central question is simple: can the path of public money be traced from source to final recipient — and can you check exactly what it was spent on?
France is especially interesting for this kind of inquiry. Old families still carry weight, an influential state bureaucracy has taken shape, and informal groups have historically played a visible role in politics. Masonic lodges took part in the life of the republic, grandes écoles graduates held key state posts, and family background still shapes access to prestigious education. None of this, by itself, means we face a single group that steers the country's money in concert.
To see who really shapes the distribution of funds, look past grand titles and assumptions: who holds office, what powers they receive, what decisions they take and whom they pay.
The word "cash pot" here does not mean a secret fund or an illegal stash. We use it for any durable channel through which money is raised, distributed or accounted for. Some cash pots are visible and follow strict rules. Others disclose only part of the picture. And sometimes the numbers are there but hard to compare: different agencies count different kinds of spending.
1. Few members — wide reach
French unions are a clear example of why an organisation's influence cannot be measured by membership alone. Comparative data on union membership and agreement coverage are collected by the European Trade Union Institute, ETUI.
According to ETUI's comparative figures, 10.1% of French workers are union members. That figure refers to 2019. But collective agreements covered 98% of workers in 2018. The first tells you how many people belong to a union. The second tells you how many workers are covered by terms that employers and unions agreed.
| Country | Union membership | Coverage by collective agreements |
|---|---|---|
| France | 10.1% (2019) | 98.0% (2018) |
| Germany | 14.1% (2024) | 54.0% (2018) |
| Netherlands | 13.8% (2023) | 72.1% (2024) |
| Italy | 30.2% (2024) | 100.0% (2019) |
| Spain | 12.5% (2023) | 92.1% (2024) |
Table 1. Union membership and coverage by collective agreements. The data refer to different years and were collected by different methods; they are a benchmark for comparison, not a single synchronised series.
France has several large union confederations. Five of them — CFDT, CFE-CGC, CFTC, CGT and CGT-FO (now FO) — hold the status of nationally representative organisations. After the 2008 reform, that status depends not on historical recognition but on the results of elections for worker representatives. In the 2021–2024 elections all five confederations cleared the established eight per cent threshold.
That matters more than it may seem. Only a small share of workers pay dues, but unions take part in negotiations whose results cover a far wider circle. So who represents workers, and on what basis, matters here at least as much as the size of the union's cash pot.
Unions and employer bodies also help run paritarian structures. They fund negotiations, vocational training and other work of social dialogue. To see how that works in practice, one concrete example is enough.
2. Old aristocracy, state careers and informal ties
France's system of influence took shape over more than one generation. Three historical layers stand out: family origin, a career inside the state, and ties formed outside official institutions.
The first layer is inherited social advantage. Legal estates were abolished long ago, but family origin still shapes educational opportunity. A study by Stéphane Benveniste, published by INSEE in March 2026, covered 269,917 students at ten prestigious grandes écoles between 1911 and 2015. In recent generations, people from families of noble descent entered these institutions six to nine times as often as everyone else. Stéphane Benveniste's study, INSEE, 25 March 2026.
The point is not that descendants of aristocrats now hold some fixed share of state posts. The study shows something else: old social advantage did not vanish with legal privilege. It keeps passing down through family, education, cultural habits and connections.
The second layer is the senior state bureaucracy. Pierre Bourdieu called it the noblesse d’État — the "state nobility". Prestigious schools and the senior corps form it: the inspectorates, the Council of State, the Cour des comptes, ministries and the leadership of state companies. Careers can continue outside the state too: officials move into the private sector, and company executives take public office. Such moves are not in themselves violations, but they can create conflicts of interest. HATVP — the High Authority for Transparency in Public Life — checks them. HATVP 2024 activity report.
The third layer is informal groups. Among them, Masonic lodges historically played a visible role. One famous example is the affaire des fiches of 1901–1904. Information on officers' political and religious views was gathered with the help of people from Masonic circles, then used in the war ministry's personnel work. The scandal ended with the resignation of war minister Louis André. Historical study of the affaire des fiches.
This shows how private ties can intersect with state personnel policy. But it belongs to the early twentieth century and says nothing by itself about how state money is distributed today.
The point is not to confuse historical continuity with proof of direct influence. Old family ties, elite-school alumni and informal groups help explain how circles of access take shape in France. But the modern flow of money must be checked against the rules, the offices and the decisions in force today.
That move from ties to powers can be seen in the paritarian fund AGFPN.
3. AGFPN: who pays, who distributes, who checks
AGFPN is a fund for financing social dialogue, created in 2015. It raises money and passes it to unions and employer bodies that take part in negotiations and other procedures the law provides for.
It is not a closed shop. Its sources of income and its distribution rules are set in law, and annual reports are published. The question is different: how carefully is it checked what recipients spend the money on.
Where the money comes from
The latest AGFPN report for 2025, available as of the publication date, came out on 1 October 2026. It lists three sources of income.
| Source | Amount for 2025 | Share |
|---|---|---|
| Mandatory employer contribution — 0.016% of the wage bill | €122.49m | 77.4% |
| State subsidy | €34.67m | 21.9% |
| Sectoral contribution from the construction industry | €1.05m | 0.7% |
| Total | €158.21m | 100% |
Table 2. Sources of AGFPN funds in 2025.
Almost four-fifths of the money comes not from the budget but from mandatory employer contributions. The state subsidy is just under a quarter of the total. So calling all €158m public spending would be wrong. But the fund cannot be called fully private either: part of its money comes straight from the budget, and the law charges it with a public function.
Who controls the money
Eight national organisations sit on AGFPN: five union confederations — CFDT, CFE-CGC, CFTC, CGT and CGT-FO (now FO) — and three employer bodies — CPME, MEDEF and U2P.
Their representatives form a 32-member board. The fund's bureau includes one representative from each of the eight organisations. The board approves allocations, the annual accounts and the list of documents recipients must use to substantiate spending. It also has the power to impose sanctions.
The result is a curious construction: the organisations that run the fund are also among those it pays. This is not a hidden deal — the fund's rules provide for exactly that arrangement. Which is precisely why it matters that spending is checked by someone other than the fund itself.
In 2026 Manuel Lecomte of CFTC became chair of AGFPN and Daniel Weizmann of MEDEF vice-chair. Board composition on the fund's website.
How the state subsidy is shared
A separate portion of state funding is reserved for social partners' role in shaping and debating public policy. In 2025 this mission was allocated €3.19m.
The eight organisations represented on the fund's board receive 80% of that sum equally — about €319,000 each. The remaining 20% is split between five other organisations: two unions and three employer bodies. The formula is set in the Labour Code, so the fund does not invent it. It is described in the AGFPN 2025 annual report.
This is where the machinery of paritarian self-government becomes clearest: social partners take part in distributing the money and receive part of it themselves. That in itself is no evidence of misuse. But a system like this calls for convincing external oversight.
What the Cour des comptes found
In May 2024 the Cour des comptes published the results of its audit of AGFPN for 2015–2022. Its verdict was harsh: oversight of how recipients spent the money allotted to them remained inadequate.
The fund relied mainly on organisations' own reports and their auditors' opinions. There was no proper system, calibrated to risk, for checking primary documents. The government commissioner, who is meant to watch over the fund's work, never once exercised the right to object during the period reviewed. The post, moreover, stood vacant for some time.
Reporting has improved since. In its 2025 annual report AGFPN said that 93.55% of the organisations from which documents were required had submitted reports in the prescribed form (as of 10 September 2026). These documents substantiated 96.66% of the funds disbursed.
On report collection, that is a good result. It does not mean an independent examiner studied every primary transaction or judged what public value the spending produced. The documents exist — the next question is who checked them, and how carefully.
In AGFPN's case the chain is quite concrete: the law defines which organisations qualify, they take seats on the fund's board, take part in distributing the money and are themselves among the recipients. Then the fund and the state bodies must check where the money went. It is at that last stage that the Cour des comptes found weaknesses.
4. Associations: the state's work done by other hands
Another large spending channel is associations and organisations of the social and solidarity economy. They help people, provide temporary housing, run education and health care, accompany migrants, assist refugees and handle a host of other tasks.
The state does not always provide such services itself. Sometimes it hands them to a non-state body and pays for the work through a subsidy, a tax break, employment support or a contract. To the user the service looks the same; in the state's accounts the money flows down different lines.
In September 2025 the Cour des comptes published a review of state support for this sector in 2018–2024. It estimated that direct subsidies came to about €8bn in 2024. Add tax expenditures, employment support and other forms of aid and the total rises to €16bn. Spending by some state operators could not be fully folded into the calculation. Local authorities alone provided close to €6.7bn in subsidies in 2023.
These sums cannot be added together. The €16bn already includes direct subsidies, and the €6.7bn belongs to a different year and a different level of government.
Almost 80% of direct subsidies went to services that in practice continue the state's work: emergency accommodation, education, social support, meals, aid to refugees, guardianship and housing help. At the same time, 93% of subsidy recipients were associations and 98% were organisations with paid staff. Money went to about 4% of all organisations in the sector.
In other words, a large share of the aid sits with a relatively small group of organisations the state relies on to deliver public services.
The total alone is not enough. You need to know what a specific service costs and who pays for it. One part may come from the budget as a subsidy, another through a tax break, a third through job support or a contract with a public body. Until these costs are brought together, you cannot compare precisely what the same service costs from one provider to the next.
5. The employers' cash pot: the UIMM case
On the employers' side there is a separate story that shows why transparency matters not only for public money.
UIMM is an influential federation of metalworking firms. Between 2000 and 2007 large sums were withdrawn in cash from EPIM, its vocational mutual-aid body. Depending on which transactions were counted, the totals ranged from €16.5m to €19m. The investigation began after a tip-off from Tracfin, France's financial intelligence unit. Le Parisien, 27 September 2007.
UIMM's then boss, Denis Gautier-Sauvagnac, refused to name the recipients. Prosecutors and the courts examined what the cash, drawn from accounts year after year, had been for. In December 2015 an appeals court gave the former boss a two-year suspended sentence and a €100,000 fine. Others were convicted too, including the organisation itself as a legal person. Le Parisien, 1 December 2015.
One important caveat: EPIM's money was the employer federation's private reserves, not state subsidies. They cannot be counted as budget spending. The case matters for a different reason. It showed that a large cash pot could exist inside an influential social-partner organisation, with flows invisible to outside observers for years.
So what needs scrutiny is not just state transfers to unions and employer bodies, but these organisations' own cash reserves.
6. Why official numbers do not always add up
To get to grips with public finance, one big number is not enough. First you need to know which organisations and transactions it includes.
The state budget is not the same as the accounts of the whole general government sector. The latter covers central government, local administrations and social insurance funds. National accounts capture transactions under their own rules. Public procurement, an association's subsidy, a tax break and a mandatory contribution to a paritarian fund are different kinds of support, and reporting treats them differently.
Add them up without a common classification and you count the same money twice. Look at only one line — direct subsidies, say — and part of state support falls out of view.
AGFPN shows the difference well. In 2025 the fund received €158.21m, but the state subsidy in that sum was €34.67m. The rest arrived mainly through mandatory employer contributions. So the fund's total resources must not be passed off as direct budget spending. At the same time the state helps pay for its work, and the law entrusts it with an important public task.
There is another difficulty: state debt, obligations and assets are measured differently. Maastricht debt is a defined set of the state's debt obligations. It leaves out everything the state may owe in the future. And the value of state assets does not mean they can be sold quickly to repay bonds.
At the end of 2025 the main figures looked like this:
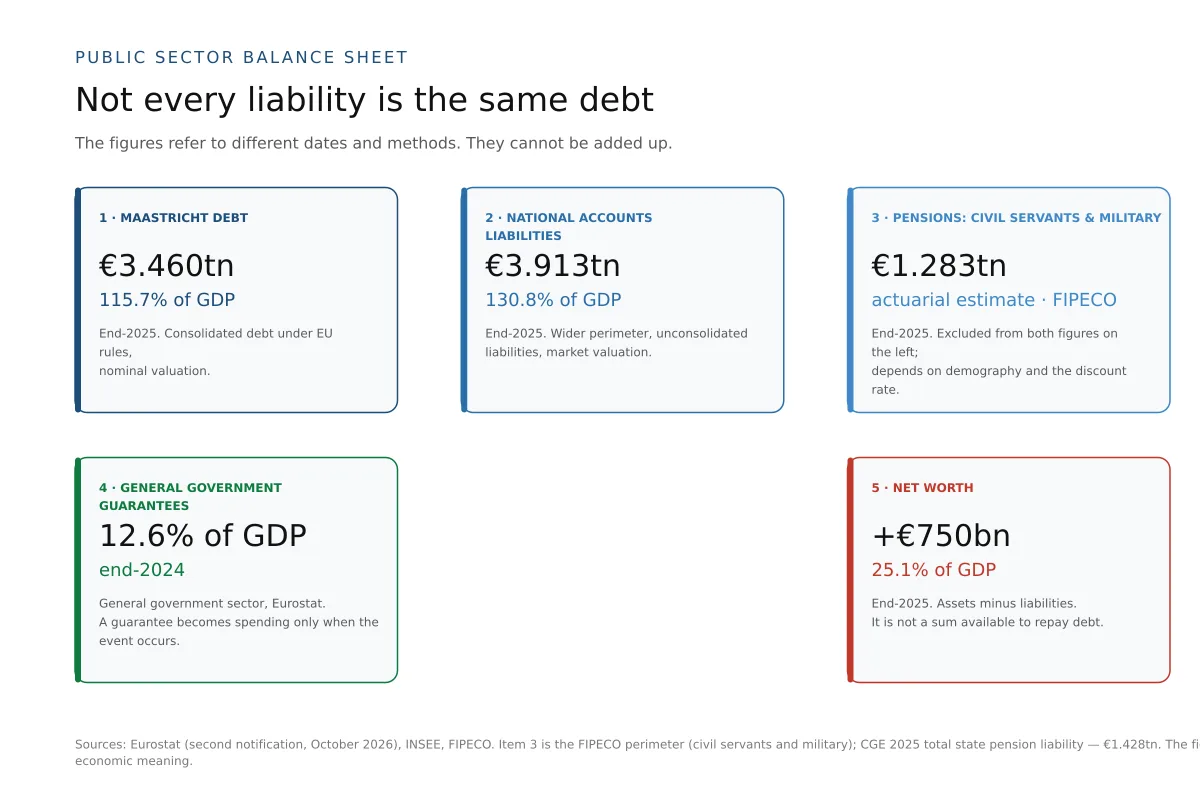
In its second notification Eurostat for October 2026 put France's Maastricht debt at the end of 2025 at €3,460bn, or 115.7% of GDP. The first notification, published in April, showed 115.6%. Updated GDP data led to a revision of 0.1 percentage points.
Total liabilities of the general government sector in the national accounts were higher — €3,913bn, or 130.8% of GDP. The net worth of general government assets was €750bn, or 25.1% of GDP.
Standing apart are the state's pension obligations to civilian and military employees. Their actuarial value was put at €1,283bn. In another document — the overall report on budget execution for 2025 — the state's aggregate pension obligations were put at €1,428bn. These are estimates with different scopes. They are not part of Maastricht debt and must not be mechanically added to it.
Then there are state guarantees. They too do not become debt automatically: a cost arises only when the event occurs that obliges the state to honour the guarantee. Until then, it is a contingent obligation.
All these measures describe different facets of the state's financial position. Maastricht debt is calculated at nominal value and netted for mutual obligations within the public sector. National accounts liabilities have a broader scope and a different valuation method. The value of pension promises depends on demographics and the discount rate. Guarantees remain contingent until the specified event occurs.
It helps to see them side by side, but they cannot be summed into one figure.
There is also a question of ownership. On FIPECO estimates, most of the debt sits at central government level, while a large share of the assets belongs to local authorities. Schools, roads and municipal buildings are real assets, but Paris cannot simply sell them to pay off government bonds. So the net worth of the public sector as a whole does not stand in for a measure of the central administration's debt.
The trouble is not that one of these numbers is necessarily wrong. It is that a reader often sees a single indicator, misses what it includes, and sets it against another number calculated under different rules. To see where public money goes, first work out what each report actually counts.
7. How big are these sums
Now set these examples against the scale of French public finance.
In 2025 general government spending totalled €1,714.2bn, or 57.3% of GDP. The deficit reached €152.5bn — 5.1% of GDP. Interest spending on the debt of the whole general government sector in the national accounts came to €64.7bn. INSEE, general government accounts for 2025.
Separately, Agence France Trésor puts the cost of servicing central government debt at €62.6bn for 2026 and budgets €72.9bn for 2027. These figures belong to the central government budget, not the whole government sector, so they cannot be set against €64.7bn directly.
Against that backdrop, AGFPN is a small fund. Its gross resources in 2025 were €158.2m, or about 0.009% of all public spending. The subsidy from the budget, €34.67m, was roughly 0.002%. This money does not explain the deficit and cannot be called the main channel of leakage.
But the fund matters as an example of how distribution works. The organisations that decide where money goes are also represented among the recipients. The Cour des comptes audited the system and found weak spots in external oversight. That is a question of governance design, not an explanation of a budget crisis.
Support for associations is bigger in scale. €8bn of direct subsidies — about 0.47% of all public spending. The broader estimate of €16bn — about 0.93%. But the second figure covers more than grants: it is a wider set of measures, including tax expenditures and employment support. Neither estimate by itself explains the €152.5bn deficit.
And yet for particular industries and organisations these sums are very large indeed. When a public service is delivered through an outside provider, it matters not only the size of the subsidy but the full cost of the service, including breaks and other aid.
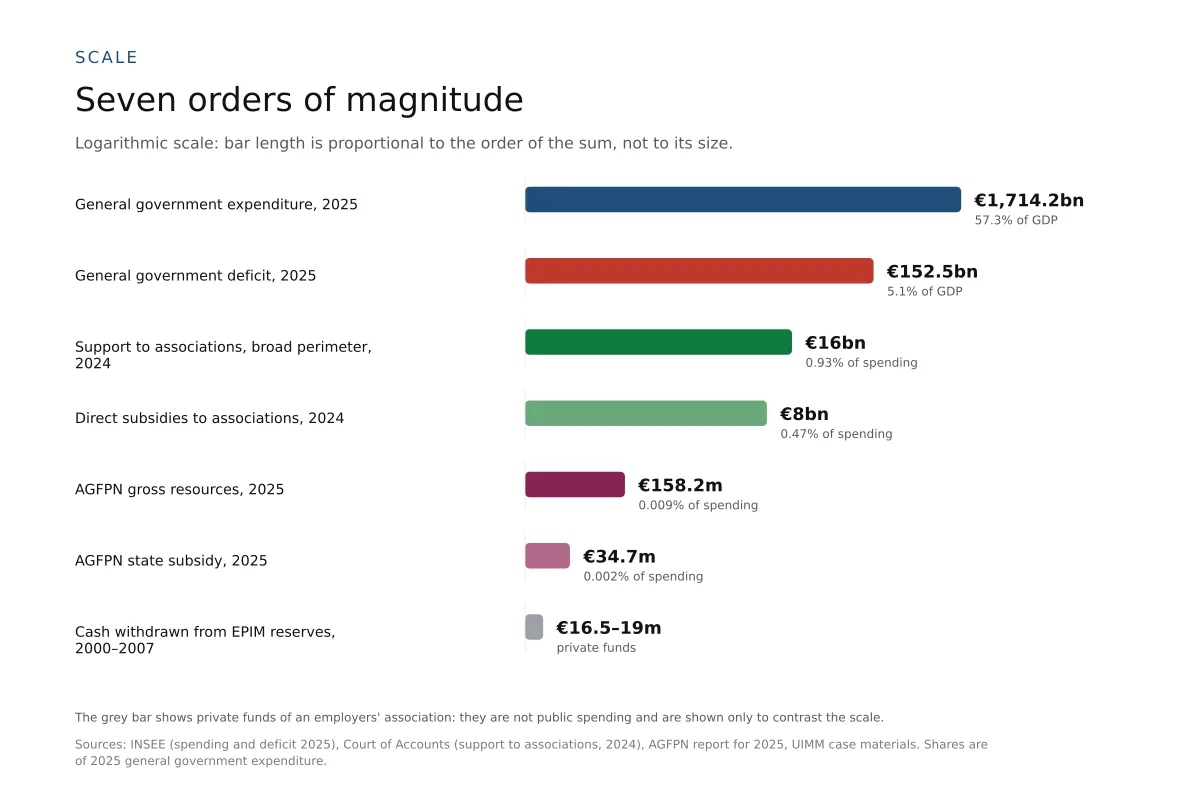
The UIMM case stands apart: it concerned employers' private reserves, not budget spending. Its amount must not enter any aggregate of public spending. But the story is a reminder that opacity can arise inside organisations that take part in official social dialogue.
8. Five countries: what changes when you compare
France is worth comparing with Germany, the Netherlands, Italy and Spain. This is not a ranking, nor an attempt to explain economies by "national character". The comparison serves another purpose: to see whether spending, debt, social dialogue and the obligations of state-linked organisations are built the same way.
| Country | General government spending, % of GDP | Maastricht debt, % of GDP | Union membership / coverage of agreements* |
|---|---|---|---|
| France | 57.3 | 115.7 | 10.1% / 98.0% |
| Germany | 50.1 | 62.8 | 14.1% / 54.0% |
| Netherlands | 45.2 | 44.7 | 13.8% / 72.1% |
| Italy | 51.1 | 136.7 | 30.2% / 100.0% |
| Spain | 45.3 | 100.5 | 12.5% / 92.1% |
Table 3. Macroeconomic figures refer to 2025 and come from Eurostat's second notification of 21 October 2026. Union membership and collective agreement coverage refer to different years; the caveats are in section 1.
Even this table shows France standing apart from its neighbours in combining high public spending with heavy debt. But it says nothing by itself about how money is distributed or how well the use of it is checked.
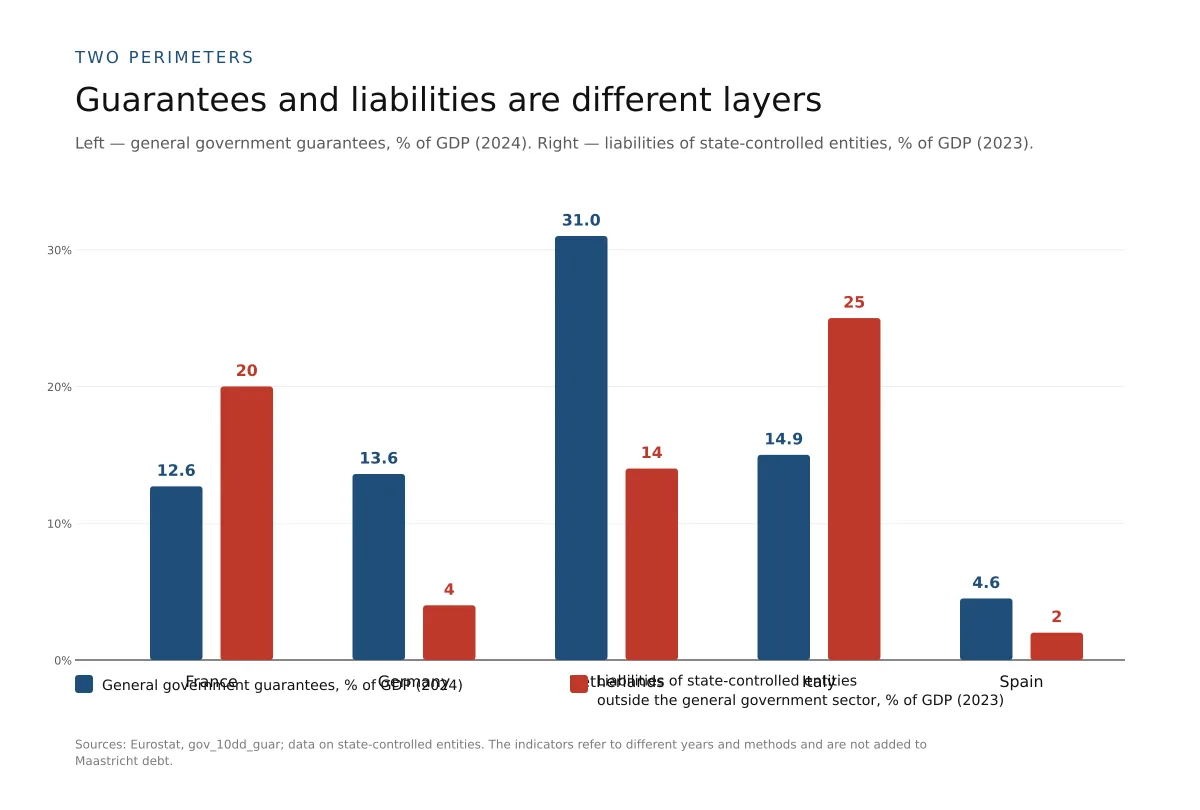
It helps to look at two other indicators: state guarantees, and the obligations of companies that the state controls but that are accounted for outside the general government sector.
| Country | State guarantees, % of GDP (2024) | Obligations of state-controlled organisations outside general government, % of GDP (2023) |
|---|---|---|
| France | 12.6 | 20 |
| Germany | 13.6 | 4 |
| Netherlands | 31.0 | 14 |
| Italy | 14.9 | 25 |
| Spain | 4.6 | 2 |
Table 4. Two different kinds of obligation. Eurostat data; country coverage may be incomplete.
Guarantees and company obligations are not the same thing. A guarantee stays contingent until the event specified in the contract occurs. The obligations of a state-controlled company are already reflected on its balance sheet, but the company itself is not part of the general government sector.
On guarantees France ranks fourth of five: only Spain is lower, while Germany, Italy and the Netherlands are higher. On the obligations of state-controlled organisations the picture differs: France's 20% of GDP ranks second after Italy's 25%. That is higher than the Netherlands, Germany and Spain.
These figures cannot be added to Maastricht debt. They show that part of the financial risks and obligations sits outside the best-known measure of public debt. And the shape of this "outer layer" differs from country to country.
Comparing five countries does not prove that the French model is worse or more opaque than the rest. But it helps ask the same questions: which organisations receive public money, who decides, where reporting is published, and who checks that the money was spent as intended.
Conclusion. The amount is not the whole question
France has long developed influential family networks, a strong state bureaucracy and groups that operate outside official politics. These ties help explain why access to prestigious institutions and decision-making centres is uneven. But for money what matters more is this: where influence is anchored in specific powers, and where it can be checked against documents.
AGFPN offers such an example. Eight social-partner organisations sit on the fund's board, take part in distributing its money and receive funding themselves. The rules are known, the sums are published, and the Cour des comptes has audited the fund and pointed to control failings. This is no longer a guess about informal influence; it is a concrete arrangement that can be studied.
Associations are more complicated: non-state bodies perform part of the state's work, and the money reaches them through subsidies, tax breaks, employment support and contracts. Look at only one form of aid and the total cost of the service drops out of sight. The UIMM story is a reminder that separate cash reserves can stay opaque even inside social-partner organisations themselves.
In scale, these examples do not explain France's deficit. AGFPN accounts for about nine thousandths of one per cent of public spending, and even the broad estimate of support for associations falls short of one per cent. But size is not the only measure of significance. These cases show how closely society can trace the path of the money, and how independent the check is once it has been transferred.
In the end the question is not how many cash pots exist in France. It is this: who decides who gets the public money, under what rules is the decision made, and who can check the result — not from the recipient's own report, but independently of the recipient?
That is where the line lies between legitimate distribution of money and spending that no one can answer for clearly.
Source material: car subsidies
State redistribution is visible even in car purchases. IMT-IDDRI and C-Ways estimate that in 2024 social leasing accounted for almost a quarter of car purchases by the lowest-income households. Among electric cars bought by private individuals, 41% went to the bottom half of the income distribution with state support.
More on prices, buyer profiles and the ageing of France's car fleet is in a separate AIERA Frontiers piece, "The French new-car market: prices, buyers and an ageing car fleet".
Sources
Social partners and unions
- ETUI — Trade unions across Europe: comparative data on union membership.
- Worker Participation — France; Germany; Netherlands; Italy; Spain.
- OECD/AIAS — ICTWSS Database.
- AGFPN — annual report for 2025, published 1 October 2026.
- AGFPN — official website, governance and board powers.
- Cour des comptes — audit of AGFPN for 2015–2022, 24 May 2024.
Elites and political networks
- INSEE — «Ascendance noble et inégalités d’accès aux grandes écoles», 25 March 2026.
- HATVP — 2024 activity report.
- Persée — study of the affaire des fiches.
Associations and state support
- Cour des comptes — «Les soutiens publics à l’économie sociale et solidaire», 2018–2024, September 2025.
- IMT-IDDRI / C-Ways — barometer of new-car prices and market volumes for 2025.
The UIMM case
- Le Parisien — investigation opened after a Tracfin report, 27 September 2007.
- Le Monde — coverage of the UIMM cash pot case, 15 May 2008.
- Le Parisien — amounts withdrawn and progress of the investigation, 13 September 2010.
- Le Parisien — appeal court ruling, 1 December 2015.
Public finance and debt
- FIPECO — general government wealth at the end of 2025, 16 September 2026.
- Budget de l’État — pension obligations at 31 December 2025.
- INSEE — general government accounts for 2025, May 2026.
- Agence France Trésor — state budget and debt-servicing cost, updated in 2026.
- Eurostat — deficit, spending and general government debt for 2025, second EDP notification, 21 October 2026.
- Eurostat — state guarantees, dataset gov_10dd_guar, data extracted 3 June 2026.
- FIPECO — contingent obligations and international comparison, 2 May 2026.
Note on the data. Union membership and collective agreement coverage refer to different years and do not form a single synchronised series. Maastricht debt, national accounts liabilities, actuarial pension obligations and state guarantees are calculated under different rules and do not add up to one sum. AGFPN's gross resources include mandatory employer contributions and the sectoral contribution, so they are not equal to direct budget spending.