
This is the reference of figures and charts behind Part 1 (how the system was built) and Part 2 (what is happening and where it is heading). Here are the visual data and simplified diagrams: numbers are simplified, logic preserved. No finance jargon.
In short: over the past 30 years, US Treasuries turned from "government IOUs" into the universal collateral of the global financial system — the asset against which the whole world borrows, hedges risk, and settles between banks. Because of this, the market no longer signals fiscal trouble the way it should.
Key numbers (TL;DR)
| Metric | Value | Meaning |
|---|---|---|
| US Treasuries | $28+ trillion | The world's main collateral. |
| "Rehypothecation" of paper | 2–3 times | One bond = several loans. |
| Panic line | ~$2.7 trillion | Below it — a credit-market crash (LCLOR). |
| Hidden fund leverage | 50–100x | Playing 100 times larger than they own. |
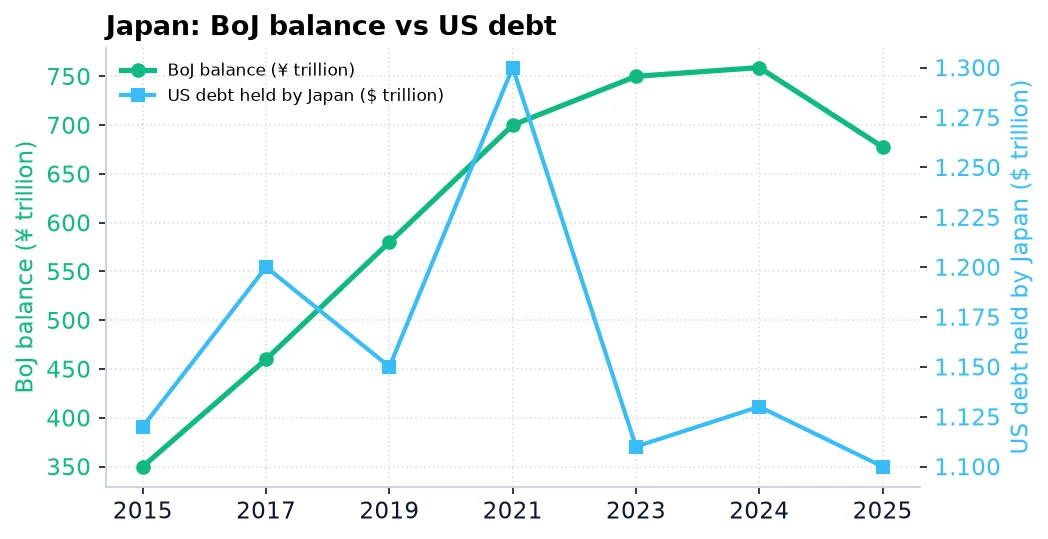
| US debt held by Japan | $1.1+ trillion | Largest foreign buyer. |
Part I. Why debt stopped being just debt
We tend to see US Treasuries as a government "IOU": it borrowed money and promised to repay with interest. In reality, over 30 years they became universal collateral — the asset against which the world borrows, hedges risk, and settles between banks.
Where the giant deficit comes from
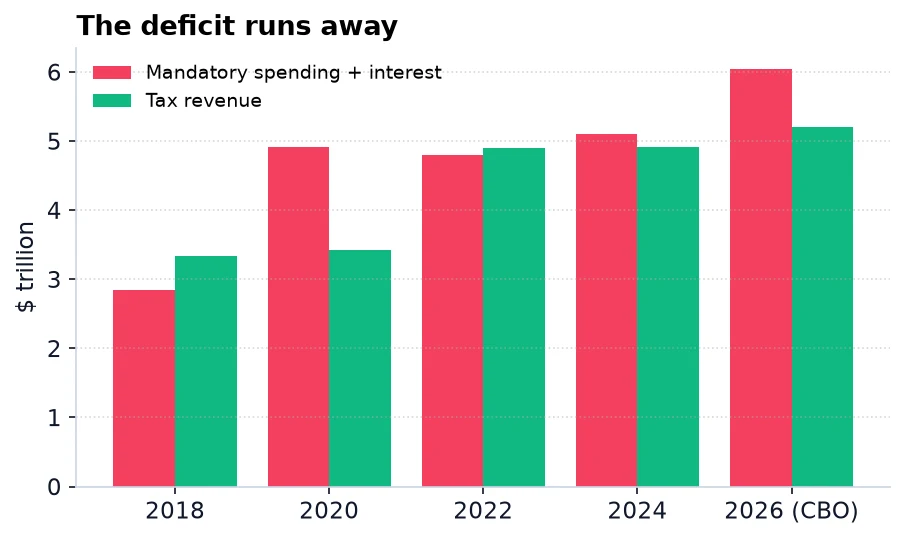
It is not a "Wall Street conspiracy" but demographics and policy: spending on pensions (Social Security) and healthcare (Medicare, Medicaid) grows faster than taxes, plus interest on the debt. The red bars are mandatory spending, the green bars are taxes: spending is running away.
"Rehypothecation": one bond backing several loans
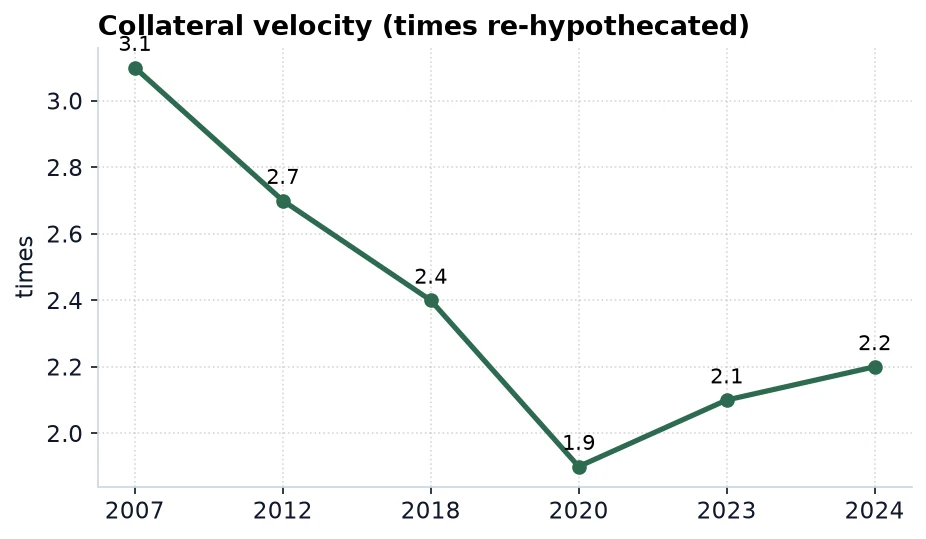
You own an apartment worth 10 million. You pledge it to the bank and borrow 8 million. The bank lends that money to another client, asking for your pledged apartment as collateral. Sounds odd, but in the bond world it is normal — rehypothecation. One bond can back 2–3, sometimes 4 deals at once. IMF economists coined "collateral velocity": the higher it is, the more credit sits under the same stack of paper.
Why the market does not "scold" the government for debt
Normally, if a government prints debt, investors demand higher yields — they "punish" it (Italy in the 2010s, Greece, Russia 1998). In the US the signal is nearly blocked: clearing houses, derivatives markets, and hedge funds must hold Treasuries as collateral (a regulator requirement). So buyers always exist, and yields do not rise as they should. An "unnatural" cushion of demand.
Part II. Why the Fed can no longer "drain" money
Usually a central bank fights inflation two ways: raising rates and shrinking its balance sheet (QT). In the US only the first works. The second is structurally blocked: the Fed cannot shrink its balance sheet because otherwise the collateral market collapses.
The Treasury maneuver 2023–2024
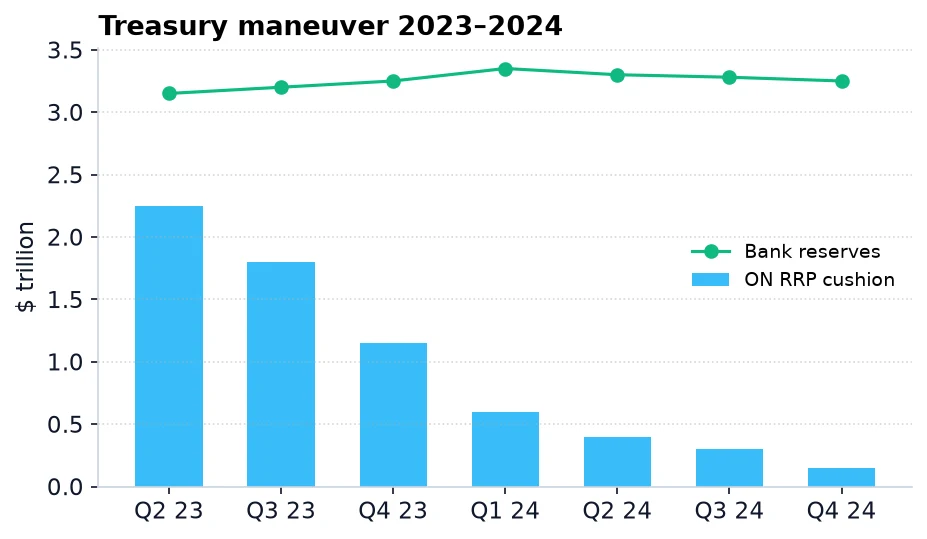
From summer 2023 the Treasury mass-issued short bills (T-bills) at a yield above the Fed's reverse-repo rate (ON RRP). Money from that liquidity "cushion" flooded into T-bills while bank reserves stayed untouched. By Miran and Roubini's estimates, the duration trick cut 10-year yields by ~0.25 pp — as if the Fed itself had cut rates by 1%. The Treasury "outbid" the regulator's own policy.
The "LCLOR wall"
The ON RRP cushion hit zero → each new T-bill pulls reserves from banks. The Fed struck LCLOR — ~$2.7 trillion, or 8% of US GDP. Below it is panic, as in September 2019. So in 2025 the Fed effectively halted QT (April 2025: $5bn/month). Analogy: you have $20 against $30 of bills; taking away another $10 leaves you without money until payday.
Part III. Hedge funds play 50–100 times larger than they own
Funds make money on the gap between a bond's price and its futures — fractions of a percent. To make that penny margin pay, they use 50–100x leverage.
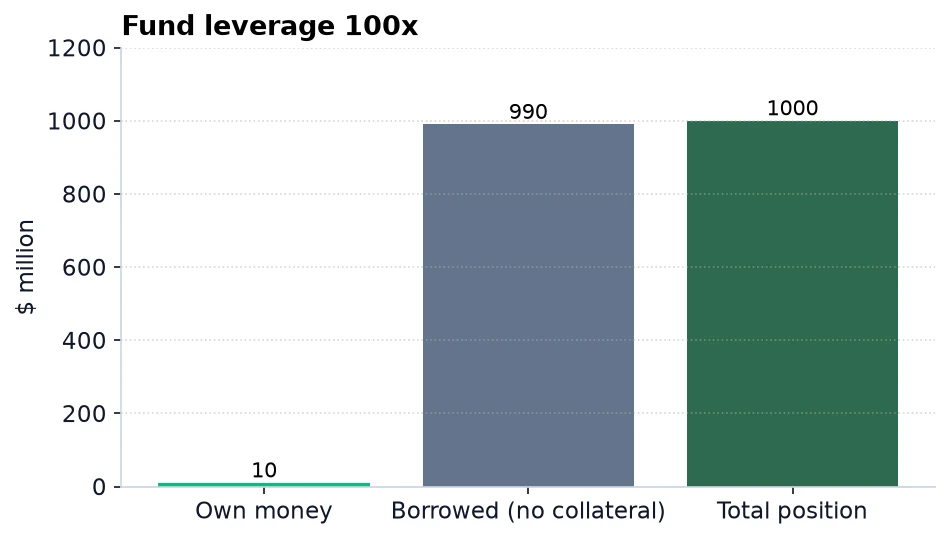
When a loss hits a critical point, dealers demand more collateral, the fund sells the bond → the price falls → other funds in the same trade get margin calls → a liquidation cascade. That happened in March 2020 — a dress rehearsal that nearly sank the Treasury market by a trillion dollars.
Part IV. How Japan became the main "donor" of American debt
In 1984, under Washington's pressure, Japan signed the Yen-Dollar Accord and opened its financial market; 1985 — the Plaza Accord (the yen jumped), then a bubble, the 1990 crash, decades of deflation and zero (2016–2024: negative) rates.
The yen became the "cheapest currency to borrow": global investors borrowed yen at 0%, converted to dollars, bought Treasuries at 4–5% — pure profit. That is the carry trade. Japanese pension funds (especially GPIF, the world's largest) also fled into US Treasuries. Japan now holds $1.1+ trillion of US debt.
The "thaw"
Japanese inflation woke up (2022–2024), and the BoJ began raising rates — for the first time in 17 years. That breaks carry-trade math: the yen strengthens, funds close dollar positions and sell Treasuries — a liquidity drain from the US. In summer 2024 the BoJ raised by 0.15 pp — and that was enough: the Japanese market fell 12% in a day, and the dollar fell 11% against the yen.
Part V. The digital "Plan B": how the Fed wants to automate it all
Since the system is so fragile, regulators are building a new one — on blockchain. Not crypto for people, but infrastructure where margin calls, collateral reallocation, and interbank settlement happen in milliseconds. Three "rails":
| Instrument | What it is | Issuer | For whom | Analogy |
|---|---|---|---|---|
| wCBDC | Central-bank digital money | The Fed | Banks only | "Cash at the Fed, just digital" |
| Tokenized deposits | Bank digital money | Commercial bank | Clients and counterparties | "Transfer in 1 second" |
| Tokenized Treasuries | Government debt in digital form | US Treasury | Banks and big funds | "A bond with a QR code" |
RLN (Regulated Liabilities Network) unites them on one platform. A margin call that in March 2020 took days by hand would be handled by a smart contract in milliseconds. But the catch: before, dealers "put out fires" by hand; now an algorithm does it, and the regulator gets direct control over the whole system. At once a "rescue from disaster" and a "new dependence" on code.
Bottom line: what it all rests on
The dollar system rests on three "crutches," each vital. Remove any — and "direct printing" of money becomes necessary.
| Crutch | What it is |
|---|---|
| 1. Endless T-bills | The Treasury prints short bills to "feed" the shadow bank with collateral. Without them the system suffocates. |
| 2. The Fed's reserve floor | The Fed keeps reserves at $2.7+ trillion, refusing to shrink its balance sheet. |
| 3. Cheap yen | As long as Japan keeps rates near zero, funds buy Treasuries with yen loans. |
This is not a doomsday forecast — it is a description of a risk already built into the system. This panel is a simplified version of a larger analytical report.
It all began in Part 1 — how debt became collateral and the Fed a hostage. In Part 2 — how the three crutches work now and how they could break.