
An analytical review based on materials from The Kobeissi Letter and US Federal Reserve data
October 2026 · 9 sections · 17 charts · ~24 minute read
Key Figures
| Indicator | Value |
|---|---|
| Top 1% share of US wealth | 32.5% — all-time high |
| Top 1% wealth growth since 2020 | +$30 trillion |
| Dollar purchasing power loss | −23% since 2020 |
| Total household net worth | $185 trillion (+83% vs. 2020) |
| Bottom 50% wealth (67.4 million households) | $4.3 trillion — merely 2.3% |
| CPI above Fed's 2% target | Over five consecutive years — first since the 1980s |
1. Introduction
On October 3, 2026, the analytical publication The Kobeissi Letter released a report highlighting the distribution of wealth in the United States. According to Federal Reserve data, the top one percent of American households controls 32.5% of the nation's total net worth. Since 2020, this cohort has added approximately $30 trillion, whereas the combined wealth of the bottom half of the population—67.4 million households—stands at $4.3 trillion. The gap between these two figures is $56 trillion.
While the original report provided a dense data snapshot with concise takeaways, this article expands upon its framework: we incorporate historical context, explain the mechanics of inflationary wealth transfer, and objectively examine where the data allows for alternative interpretations.
To begin, two working definitions are in order. Net worth represents the total value of a household's assets (real estate, equities, bank accounts, business equity) minus all liabilities (mortgages, loans, debts). Federal Reserve data under the Distributional Financial Accounts (DFA) framework is compiled quarterly, capturing the entire US economy from the top percentile down to the lowest deciles.
An important methodological note: all key figures cited here reflect Federal Reserve and The Kobeissi Letter data without proprietary methodology adjustments, supplemented by granular breakdowns of series often omitted from brief summaries.
2. Wealth Growth: $84 Trillion in Six Years
In 2009, at the depths of the subprime mortgage crisis, total US household net worth stood at roughly $55 trillion. By the start of the pandemic in 2020, it had reached $101 trillion. Over the ensuing six years, from 2020 through 2026, this metric surged to $185 trillion (with some estimates placing it at $185.7 trillion), adding a record $84 trillion in an unprecedentedly short span. The 2020 baseline needs a caveat: $101.8 trillion was the bottom of the pandemic market crash (Q1 2020). From the pre-crisis peak of Q4 2019 — $107.6 trillion — the gain is not 83% but about 72%, and that is the base all growth shares below are measured against. The absolute scale of growth over these six years exceeds the total size of the US economy for much of our historical timeline.
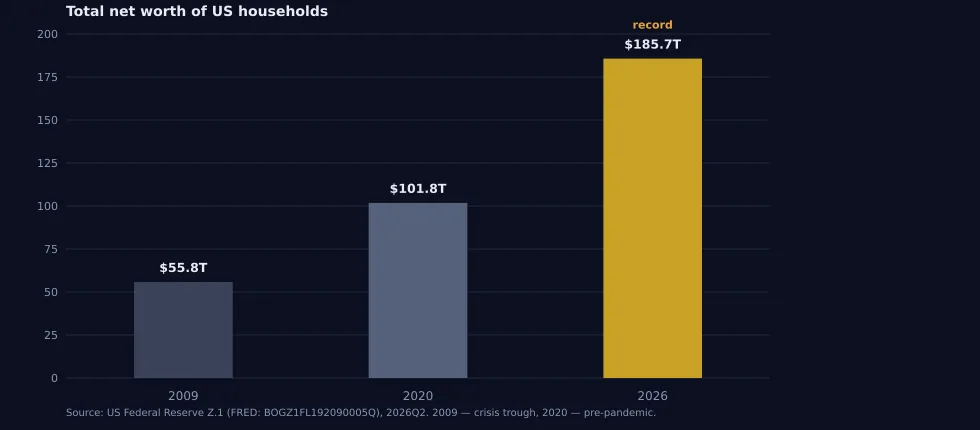 Figure 1 — Total US household net worth, in trillions of dollars. Source: US Federal Reserve (DFA).
An aggregate figure alone reveals nothing about who captured this growth. A massive nominal expansion in national wealth can mask profound polarization, where a substantial share of gains concentrates on the balance sheets of a narrow group of asset holders, while mainstream incomes lag behind inflation.
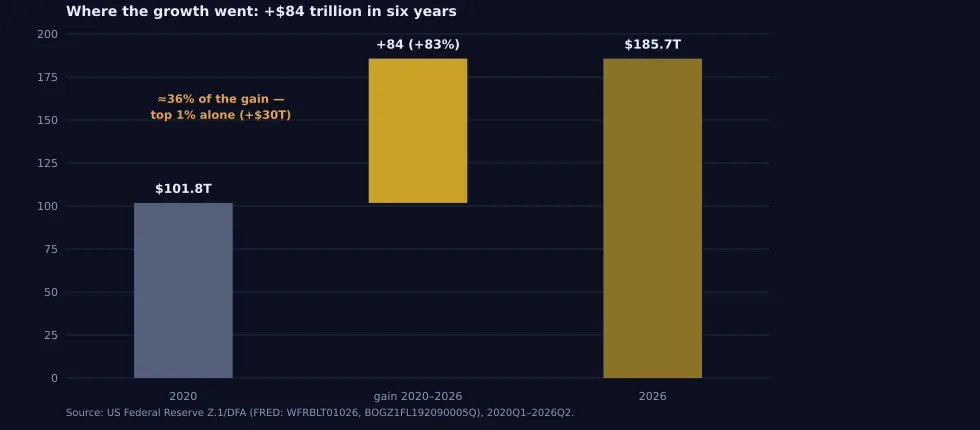 Figure 2 — Where the wealth growth went, 2020–2026. Source: calculations based on Federal Reserve data.
Let us compile the core figures of our analysis into a single table to which we will return throughout the article.
| Indicator | Value | Commentary |
|---|---|---|
| Total net worth | $185 trillion | +83% vs. 2020 level |
| Top 1% share | 32.5% | Historical peak (Fed DFA) |
| Top 1% wealth gain | +$30 trillion | Since early 2020 |
| Bottom 50% wealth | $4.3 trillion | 67.4 million households |
| Bottom 50% share | 2.3% | Combined share of national wealth |
| CPI inflation | Above 2% | Over 5 consecutive years (since 2020) |
| Dollar depreciation | −23% | Purchasing power since 2020 (CPI-based) |
Table 1 — Key indicators of US wealth distribution. Sources: US Federal Reserve, BLS; based on materials from The Kobeissi Letter.
3. Wealth Distribution: Who Owns a Third of the Pie
The top percentile's share of national wealth spans a history of nearly four decades. In 1989, when the Federal Reserve began tracking distributional statistics, the top 1% held approximately 23% of wealth. By 2000, at the peak of the dot-com bubble, this share first approached 28%, subsequently dipping after each crisis only to rebound at a higher plateau. Since 2020, it has climbed 3.5 percentage points — from 29.0% in early 2020 to 32.5%. The core lesson of the chart is that each cycle of inequality "compression" proves weaker than the last, while the intervening upward trend grows steadily steeper.
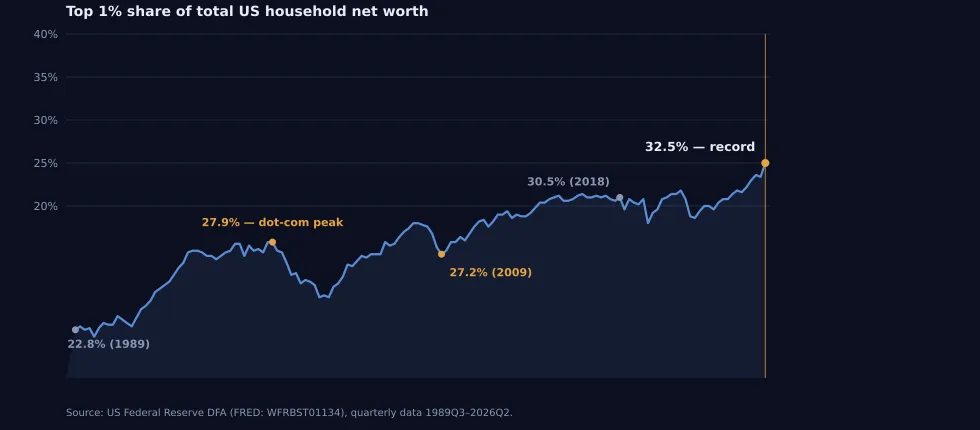 Figure 3 — Top 1% household share of total US net worth, 1989–2026, %. Source: US Federal Reserve (DFA).
Consider the arithmetic of the gap. The top percentile encompasses roughly 1.4 million households holding $60.3 trillion. The bottom half—67.4 million households—holds $4.3 trillion. On a per-family basis, this averages out to roughly $43 million for the top 1% versus $64,000 for the bottom 50%—a disparity of nearly 670x. Comparing aggregate cohort wealth yields a ratio of $60.3 trillion to $4.3 trillion, or roughly 14x. A single group of one percent — 1.4 million families — commands wealth fourteen times the combined savings of the bottom half of the country.
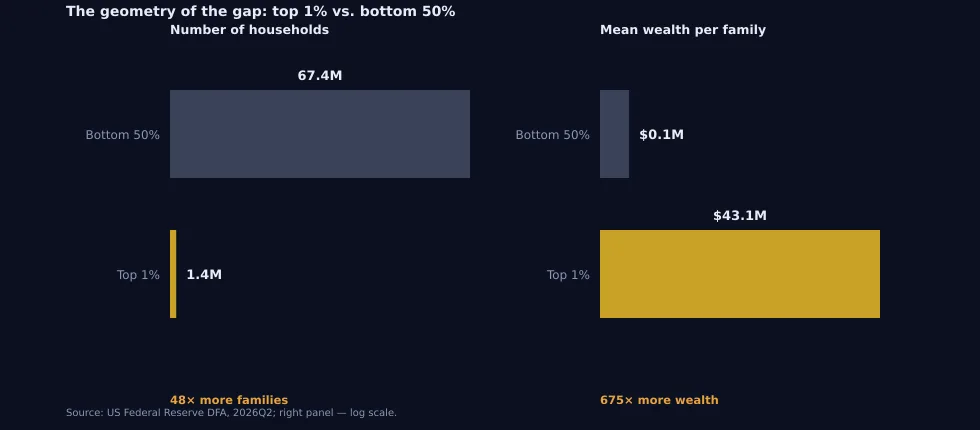 Figure 4 — Two dimensions of the gap: number of households (left) and average wealth per family (right, logarithmic scale). Source: calculations based on US Federal Reserve (DFA) data.
Among intermediate groups, the trajectory is equally revealing. The top 10% decile controls over two-thirds of national wealth, leaving middle deciles with diminishing financial maneuverability. The traditional middle class—households ranging from median wealth to the 90th percentile—faces the phenomenon of "squeeze from within": assets appreciate, but debt burdens and liability servicing costs outpace income growth.
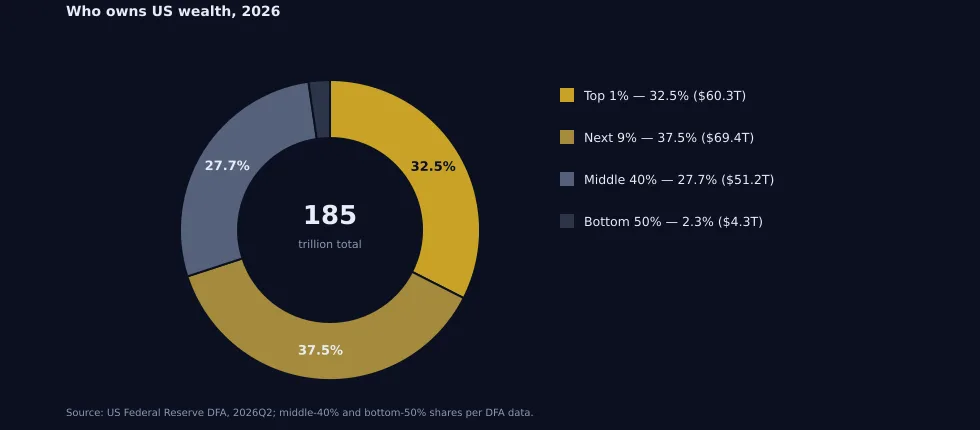 Figure 5 — Who owns US wealth: group shares, 2026. Source: US Federal Reserve (DFA).
The escalation does not stop at the top percentile. The top 10% of households now control fully 70% of the nation's wealth. Within that, an even narrower slice—the top 0.1%, roughly 135,000 households—has doubled its fortune since 2019: a gain of $14.5 trillion, or about $107 million per household. Economists call this division K-shaped: one branch of the economy, the one that owns assets, climbs sharply, while the other, the one living on paychecks, barely moves—and in real terms, inflation-adjusted, it actually declines.
4. Redistribution Mechanisms: Fiscal Stimulus and Inflation
Where did the top 1%'s $30 trillion in growth over six years originate? The answer lies in a combination of unprecedented fiscal injections and monetary policy. Between 2020 and 2021, the US government deployed stimulus packages totaling nearly $5 trillion (including the CARES Act and the American Rescue Plan). Funds flowed via direct checks to citizens, expanded unemployment benefits, and extensive business assistance programs such as the Paycheck Protection Program (PPP).
One point deserves a closer look: the state did not extract any of this money through taxation. Instead, issuing new money diluted the purchasing power of every dollar already sitting on the balance sheets of households and companies. The bill went, in the end, to everyone holding savings in cash.
One caveat is mandatory: the inflation tax is asymmetric, and for debtors it works as a gain. A homeowner with a fixed-rate mortgage services an old schedule with devalued dollars, and the bottom half holds its wealth mostly in housing with debt — its real debt burden falls. The claim that inflation transfers real wealth to asset owners is therefore incomplete: it redistributes from creditors to debtors and from holders of money to holders of obligations. Nor is it explained by money printing alone: broken supply chains, the energy shock and the aging of globalization all contributed to the 2021–2026 inflation.
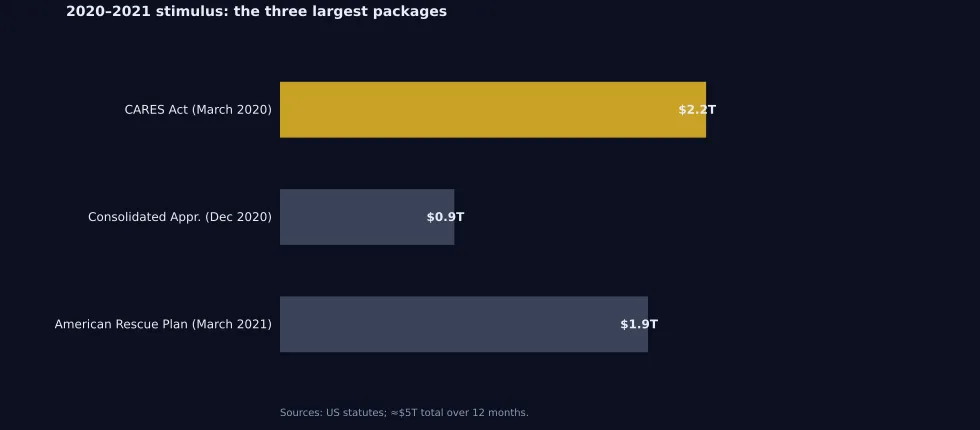 Figure 6 — Three largest fiscal support packages, totaling roughly $5 trillion. Source: US Treasury, CBO.
Yet the impact of these injections proved asymmetric. In the short term, stimulus checks bolstered consumer demand and reduced poverty rates; in the medium term, however, they triggered a powerful inflationary impulse. The Consumer Price Index (CPI) exceeded the Fed's 2% target for over five consecutive years—a phenomenon unseen since the inflationary shocks of the 1980s.
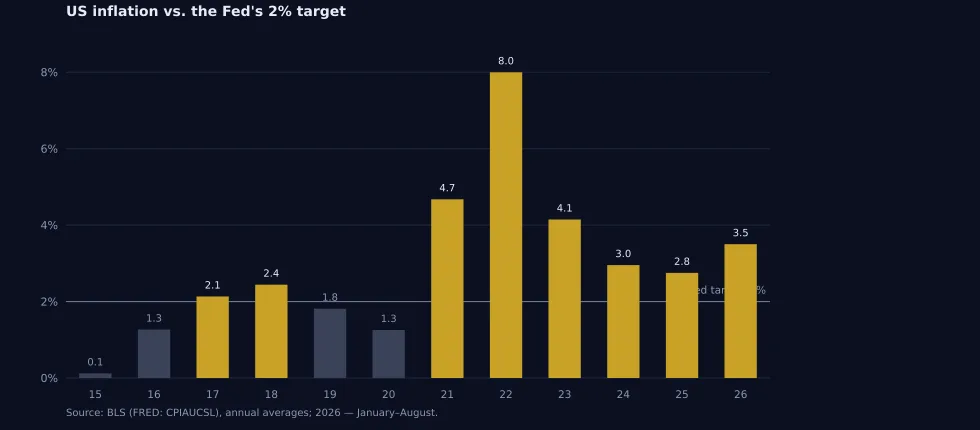 Figure 7 — US CPI inflation versus the Fed's 2% target: number of consecutive months above target. Source: BLS, FRED.
Inflation operates as a hidden tax on those lacking access to yielding assets. Since 2020, the purchasing power of the dollar has dropped by approximately 23%. For households holding savings in bank accounts and cash, this translates into a direct, confiscatory transfer of real value to the holders of hard assets—real estate, equities, and corporate capital.
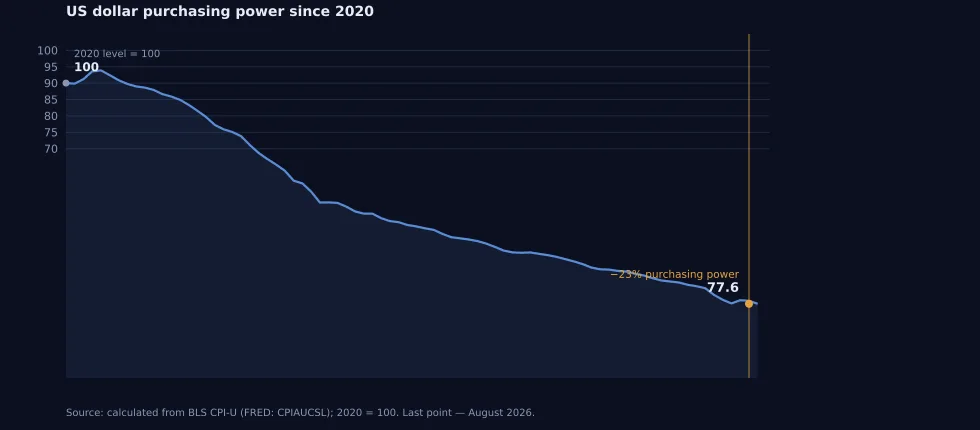 Figure 8 — Purchasing power of the US dollar since 2020 (base index 2020 = 100). Source: BLS.
5. Portfolio Structure: Why Asset Ownership Matters
The divergence in wealth growth rates between top and bottom deciles is rooted in asset structure. According to Federal Reserve data, the top 1% owns over half of all corporate equities and mutual fund shares nationwide, while the top 10% controls nearly 89% of the stock market. The bottom 50% of the population holds its modest savings predominantly in real estate (largely encumbered by mortgages) and cash equivalents.
The mechanism closes on itself: growth in capital markets flows automatically to those who already own them, and almost never reaches those who own nothing but their labor income. The top 0.1% keep roughly 60% of their portfolios in stocks and mutual funds; the next 9.9% hold about 38%; the middle 40% store roughly 13%, mostly through pension accounts; and the bottom half holds just 4% in equities.
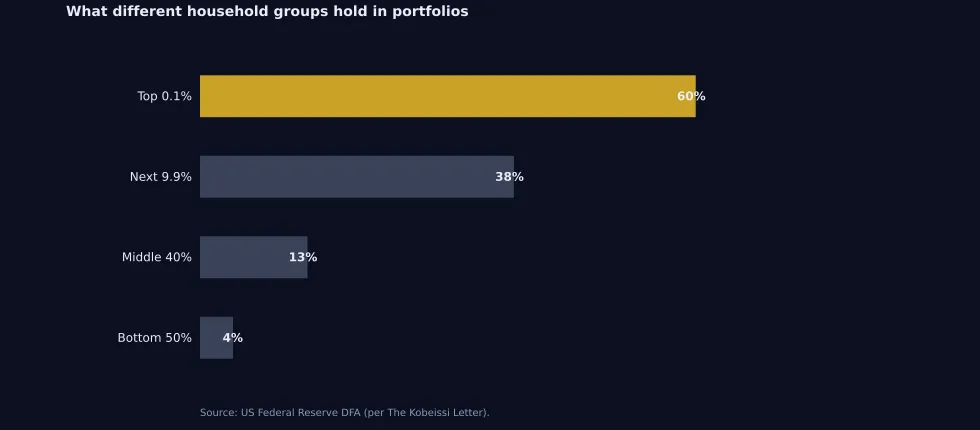 Figure 9 — Share of stocks and mutual funds in household group portfolios. Source: US Federal Reserve (DFA).
When the central bank cuts rates and floods markets with liquidity, equities and real estate appreciate at outsized paces. Asset holders watch their net worth swell by millions of dollars without additional labor input. Meanwhile, the wage earner whose income is indexed below inflation finds that real wages are shrinking while housing and essential services surge out of reach.
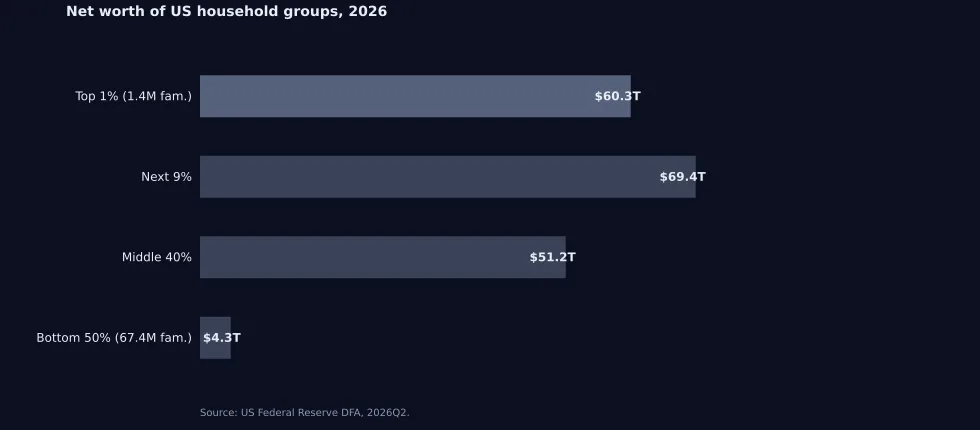 Figure 10 — Total net worth of US household groups, 2026, $ trillion. Source: US Federal Reserve (DFA).
6. Historical Context: Do Former Equalizing Mechanisms Still Work
A wealth concentration of 32.5% is not an absolute historical peak for the United States. In 1929, on the eve of the Great Depression, the top 1% share approached 35%–36%. Following World War II, under the influence of progressive taxation, a robust labor union movement, and the rapid expansion of the industrial middle class, this metric receded to a low of 22%–23% by the late 1970s.
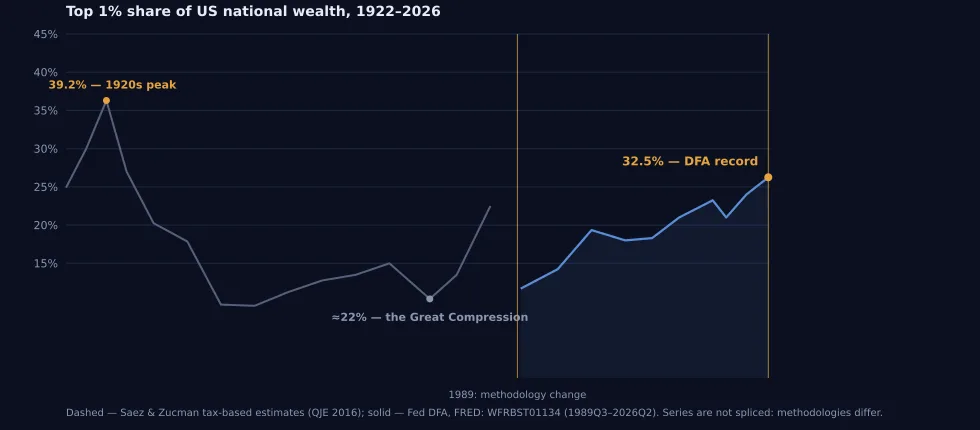 Figure 11 — Top 1% share of US national wealth, 1922–2026. Sources: Saez & Zucman (2016), US Federal Reserve (DFA).
However, historical comparison requires understanding structural shifts. Postwar equalization rested upon two powerful shock absorbers: the dominance of the real sector in the economy and the unquestioned stability of the dollar as the global reserve currency. The US produced physical goods, exported them in exchange for raw materials, paid high wages to blue-collar workers, and lifted the broader economy through the tax multiplier.
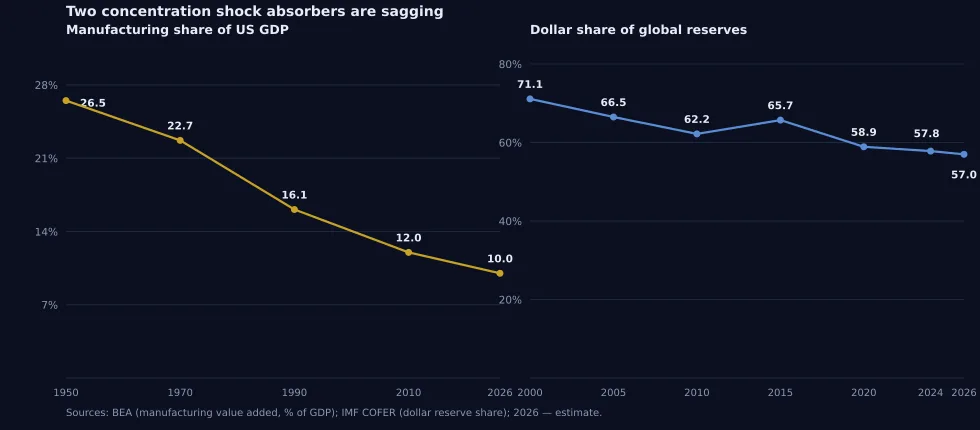 Figure 12 — Two mechanisms of concentration: manufacturing share of US GDP (left) and dollar share of global foreign exchange reserves (right). Sources: BEA, IMF COFER; 2026 estimate.
Today, both mechanisms are faltering simultaneously: the manufacturing share of GDP has fallen to approximately 10%, while the dollar's share of global reserves has declined from 71% in 2000 to roughly 57%.
A demographic adjustment is essential here; without it, cross-era comparisons are misleading. The US population has grown from roughly 225 million in 1979 to approximately 340 million today, meaning raw employment figures understate deindustrialization. To maintain the per-capita industrial employment share of 1979, the economy would require roughly 29–30 million factory jobs today; in reality, there are approximately 13 million, or 44% of the 1979 level. Furthermore, the demographic composition has shifted: the foreign-born share has reached approximately 15%–16%, educational attainment has assumed a "dumbbell" distribution (about 11% of adults held college degrees in 1970 versus roughly 38% today), and today's bottom half works not in factories but in services, where productivity and wage growth lag structurally. Modern industry hires sparingly and recruits technicians: TSMC's chip fabrication plant in Arizona entails roughly $65 billion in investment and about 6,000 direct jobs, whereas a 1950s steel mill supported tens of thousands. The old mechanism can no longer physically uplift today's cohort.
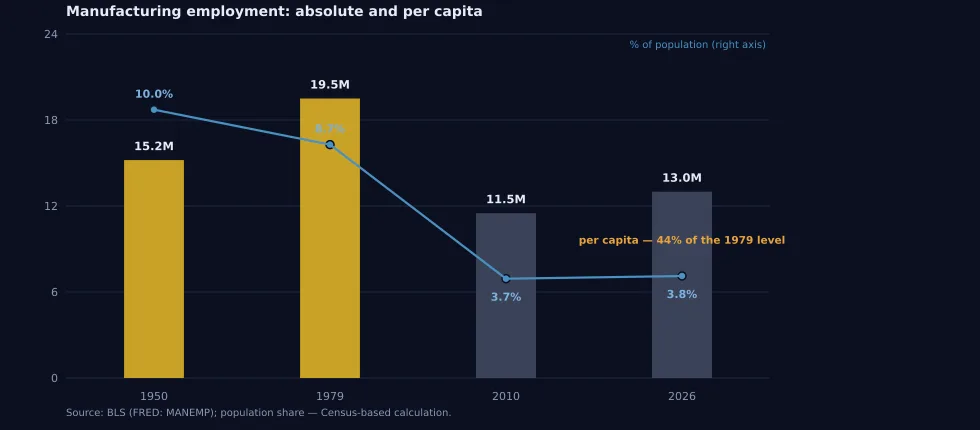 Figure 13 — US manufacturing employment: millions of jobs (bars) and percentage of population (line). Source: BLS, Census; 2026 estimate.
Demographics also alter the optics of wealth itself. Average household net worth in US data sits at roughly $1.37 million ($185 trillion across 134.8 million families), but this figure is heavily skewed by the upper deciles. Median net worth—reflecting the family sitting precisely at the midpoint of the distribution—stands at only around $220,000, nearly six times lower than the mean. The widening gulf between mean and median figures serves as the premier thermometer of true polarization.
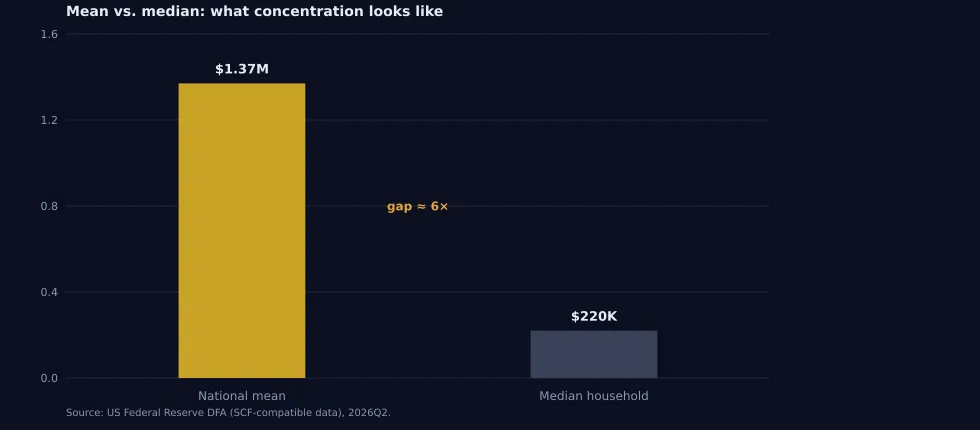 Figure 14 — Mean and median US household net worth, 2026. Source: calculations based on Fed (DFA) and SCF data; median value is an estimate.
7. Wealth Concentration and Structural Shifts
The mechanics turning wealth concentration into a structural challenge for the economy can be understood through three forces. First, the marginal propensity to consume declines sharply with wealth: a family with $100,000 spends nearly all its income, whereas a billionaire is physically incapable of spending even a fraction of a percent of their cash flow. Every dollar migrating upward is effectively removed from consumer circulation. Second, capital outpaces wages (r > g), with the accumulation velocity accelerating alongside scale: large capital secures cheaper credit, wields stronger lobbying power, and enjoys superior tax optimization and monopoly rents. Third, rentier filtering: modern capital increasingly relies on transactional rents, ranging from share buybacks (roughly $1 trillion annually across the S&P 500) to rents and fees. Every dollar spent on buybacks is a dollar withheld from wages.
The paradox of this configuration is that it undermines the very consumer demand feeding the broader economy. Consumer spending accounts for roughly 68% of US GDP, and Moody's estimates that the top 10% already drive nearly half of all expenditures. This gives rise to "K-shaped consumption": a boom in luxury brands coexisting with a boom in dollar discount stores. The bottom 50% hold 2.3% of wealth yet generate approximately 18% of consumer demand. The economy leans upon those whose incomes are depleted first. Historically, the system was propped up by two mechanisms: first, private credit—credit cards, auto loans, student debt—which functioned until the 2008 crisis; subsequently, public debt took the baton.
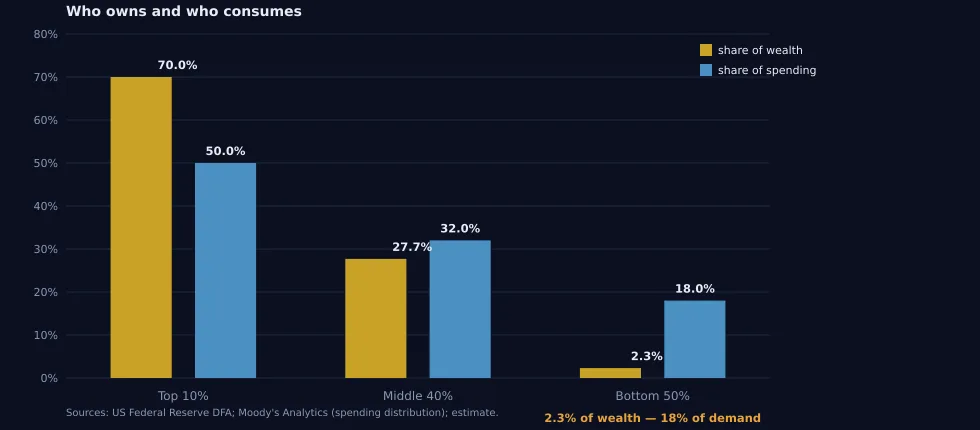 Figure 15 — Three forces in numbers: household group shares of national wealth and consumer expenditures, %. Sources: Fed (DFA), Moody's Analytics; estimate.
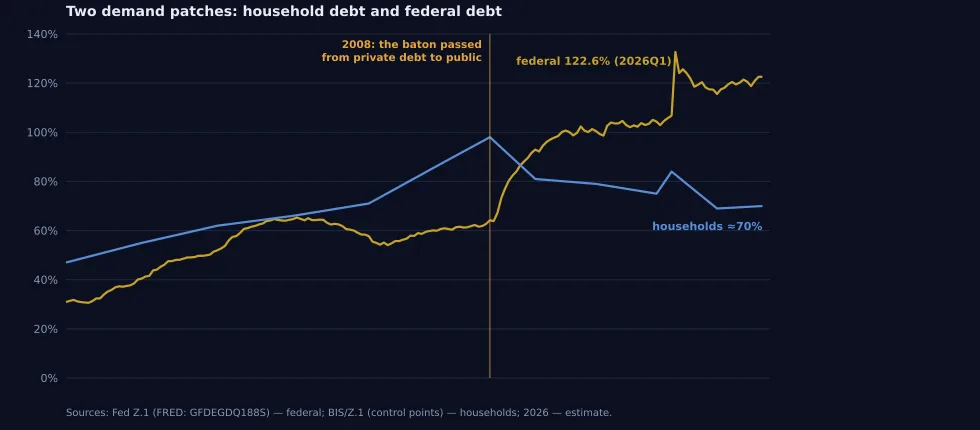 Figure 16 — Two mechanisms of demand support: gross federal debt and household debt, % of US GDP. Source: FRED; 2026 estimate.
A deeper conceptual framework is offered in economic literature. Giovanni Arrighi in The Long Twentieth Century articulated an observation tracing back to Fernand Braudel: every global economic hegemony—Genoa, the Netherlands, Britain, the United States—culminates in a phase where capital shifts from production to finance. The governing formula: financialization is a hallmark of the late cycle. Britain from 1890 to 1914 is a textbook example: industrial leadership ceded to Germany and the US, while capital lived on overseas investments and City commissions. American symptoms of this identical phase are evident: finance and real estate generate roughly 21% of GDP versus ~16% in 1980; the number of public companies has halved since 1996 (from ~8,000 to ~4,200); the share of young startup firms has dropped from 12%–13% to ~8%; corporate profit markups have risen from ~20% to ~60%; and stock market capitalization has reached ~220% of GDP against a historical norm of 85%–100%. Venture capital, meant to serve as an antidote, has itself turned speculative: entry costs at the frontier of AI measure in the hundreds of millions and billions of dollars, while circular vendor financing (investors buying client shares, clients purchasing vendor services) reproduces the telecom overbuilding cycle of 1999–2001 on an incomparably grander scale.
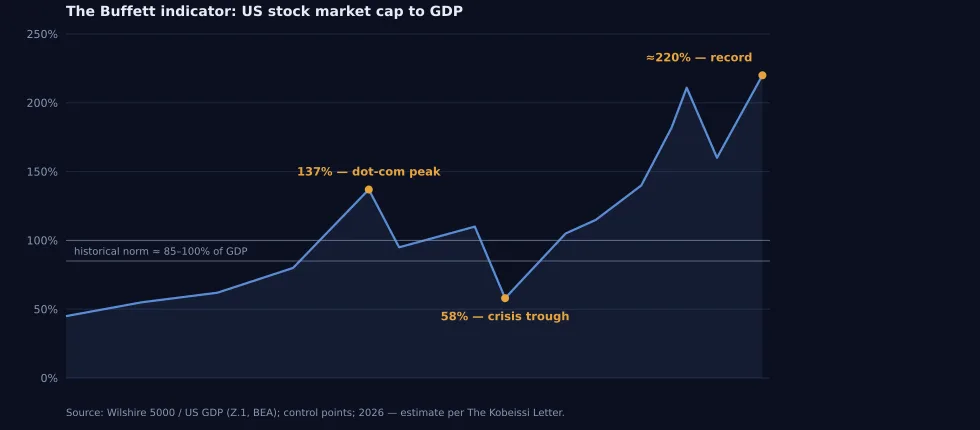 Figure 17 — Buffett Indicator: US stock market capitalization to GDP, %. Source: estimate based on Wilshire 5000/FRED data; 2026 estimate.
Two caveats caution against definitive conclusions. First, late phases endure for decades: Britain's spanned roughly half a century, and American financialization has been underway since the 1980s, meaning it could stretch across another generation. Second, the US represents an anomaly against historical templates. By 1913, Britain had lost both its industrial base and monetary supremacy, whereas the United States combines a rentier financial structure with technological leadership and the exorbitant privilege of the dollar. Yet the principal historical safety valve—external expansion—is now sealed. Global trade openness has plateaued since 2008 (it took the world eighty years to restore 1913 trade levels), markets are fragmenting into tariff and sanction blocs, and global military spending has reached approximately $2.7 trillion. When capital has nowhere outward to expand, its energy turns inward toward domestic polarization and outward toward geopolitical conflict. In this sense, the question of "what comes next" is no longer purely economic.
8. Future Drivers: AI, Bonds, and Open Questions
The concluding section of the report highlights two key drivers that the authors believe could widen the wealth gap further. First is the AI revolution: capital-intensive technologies accrue primary benefits to asset owners (hardware, foundational models, compute capacity) rather than wage earners, translating productivity gains into corporate profits and market capitalization while bypassing wages. Second is inflation, which—judging by the stickiness of government expenditures—has not been decisively vanquished. The convergence of these forces makes a repeat of the inequality "compressions" seen in the 1990s or 2000s unlikely absent profound structural shocks.
Should any doubts remain, the authors suggest observing the bond market. Yields on 30-year US Treasury bonds have climbed to highs not seen since 2002 against the backdrop of a record federal budget deficit. Long-term rates establish the foundational cost of money within the economy: the higher they are, the costlier mortgages and business loans become, intensifying competition for private investor savings. In such an environment, passively holding cash in bank deposits or checking accounts guarantees an after-tax loss against inflation.
Like any bold thesis, this picture admits counterarguments, and an honest analysis must address them. First, the "middle class" is an amorphous category: consumption among the bottom 50% is cushioned by transfer payments and credit, making the decline in living standards appear milder than the drop in net worth. Second, at the 2000 dot-com peak the top 1% share reached 27.9%, suggesting part of the current surge may represent asset revaluation that could reverse during a market correction. Third, the Fed's DFA framework imperfectly accounts for pension entitlements, making the condition of middle cohorts appear worse than it is once future benefits are factored in. The direction of the trend—a steady concentration of wealth at the top—is documented independently: Fed DFA data, the SCF survey, tax statistics. But signs of institutional erosion are already facts, not forecasts: in August 2025 the head of the BLS was dismissed after an unfavorable data revision, and by an AP review the administration has been found by courts to have violated its own orders at least 31 times since February 2025.
9. Rome as a Warning
Comparing the current American president to Caligula is tempting and useless: Caligula arrived in 37 AD, when the republic was long dead — and it had spent a hundred years dying, from the Gracchi to Caesar. It was not madmen who killed it but a mechanism. The mechanism is what deserves attention.
By the mid-second century BC Rome lived on tribute: grain from Sicily and Egypt, taxes from Asia collected by the publicani — the tax-farmers and financiers of their day. Cheap grain ruined the Italian peasant; land was absorbed into slave-worked latifundia, and those who had once fed and armed the republic became a landless urban mass. Tiberius Gracchus proposed in 133 BC to return land to those who worked it, and was beaten to death by senators; from then on the republic answered such questions with force alone. The American analogue needs no invention: Chapter 12 farm bankruptcies rose 46% in 2025 to 315 filings; April 2026 alone brought 62 — more than in any month since 2020; farm-sector debt is heading for a record $624.7 billion. The causes are particular, the structure is familiar: those who produce the food pay for conditions set by someone else.
Rent distorts politics too. In 54 BC election bribery grew so heavy that borrowing rates for candidates jumped from 4 to 8% — from Cicero's own letter, which later names the price: ten million sesterces for the vote of a single century. Elections became a market for access. In America votes are not bought, but access is expensive: in 2024 the Harris campaign spent about $875 million against $355 million for Trump, and Trump's operation for the first time raised more from large donors than from small ones. Money does not pick the winner — it picks who reaches the final at all.
In Rome the princeps's favor was measured by your seat at the table: morning client visits, your place on the couch at dinner, the contracts and judicial leniency that followed — none of it written down anywhere. On September 29, 2026, some thirty tech executives dined at the White House; the president posted the seating chart himself — seated between Nvidia's chief and Musk, with Zuckerberg and Pichai nearby — and announced that the leaders had signed a “constitution” of AI self-governance, having previously called AI fears “a hoax.” These people are not a bloc: Musk and Thiel invested in the victory early and with intent; Zuckerberg arrived after it — dinner at Mar-a-Lago, $1 million to the inaugural fund, the end of third-party fact-checking, with an antitrust suit still hanging over his company. These are clients, not allies. The elite split the way the Roman one did — and it is inside it, not between it and the people, that the outcome is decided.
Access has become rent in public money as well. The General Dynamics plant in Mesquite cost, by the Army's own estimate, $533 million and produced not a single usable shell: Congress had waived part of the procurement rules in advance, and the contractor was paid by milestones, not results — the arrangement Romans called a tax farm: payment for the right, not the outcome.
That winter the arrangement became literal. The White House demolished the East Wing and announced a ballroom funded by private money, “at no cost to taxpayers”: the estimate grew from $100 million to $400 million; the list of 37 donors was published in October — Amazon, Apple, Alphabet, Microsoft, Meta, Palantir, Lockheed Martin, Booz Allen. Alphabet, by then, had paid $24.5 million to settle the president's lawsuit over the suspension of his account. The contract between the White House, the National Park Service and the fund was disclosed only through court action brought by Public Citizen; it allows donors to remain anonymous and contains no conflict-of-interest safeguards. By the organization's own count, 14 of 27 known corporate donors received new or expanded federal contracts worth $50 billion within six months, and 16 appear in federal investigations, ongoing or suspended; the organization itself cautions that this proves no causation — there is no control group, and Lockheed wins tens of billions without any ballroom. Proof is unnecessary: the arrangement is enough. Whoever pays for the princeps's building has business before the princeps, and the full list of payers is closed to inspection. The courts twice held that construction without Congress's consent was unlawful; the Supreme Court, 5–4, allowed it to continue without reaching the merits. While the argument ran, the hall reached two-thirds completion.
Augustus never abolished the republic — he “restored” it: the senate, the magistracies and the elections remained, the substance left. For that he received power, because he promised what the republic could no longer deliver: peace after civil war, and bread. Hence the question to ask about America — not “who will be the Caligula,” but which promise it has stopped keeping: the protected saving, the job, the intelligible rules, the ability to build anything within a reasonable time. Part of society will trade freedom for predictability if nothing else is on offer: the principate arrives not as a conspiracy but as a payment.
America, however, has what Rome lacked: a written constitution, federalism, an independent press, regular elections whose results the loser concedes. That is not a guarantee, only a difference — and it converts into a checklist. Do elections happen, and are the results conceded? Does the executive obey the courts? Do the statistics and the central bank stay independent? Is the press free? Does Congress hold the budget? While the answers are yes, this is a protracted late phase, not an end. If they start changing, Rome has already shown what it looks like: at first, everything stays in place.
What the Data Shows
Federal Reserve data captures a structural shift that defies traditional economic models. Aggregate wealth is expanding at record rates, yet its distribution grows increasingly concentrated, while the mechanisms that historically counterbalanced this concentration operate feebly or not at all.
Whether this is an irreversible late phase in the Arrighi-Braudel sense or an overheating before a new growth wave, no one can say in advance: historically, late phases last decades. One thing is clear: wealth preservation rules that functioned in the 2010s require revision under current conditions. In a world where the currency systematically loses purchasing power, long-term savings denominated purely in nominal terms come under severe pressure. Understanding this mechanism constitutes half of the defense against it; the other half is a sober appraisal of the cycle governing it.
As historical frameworks demonstrate, the late cycles of hegemonic powers culminate not in soft landings but in a rewriting of the rules of the game. The question is when and in what form this will occur this time around.
Sources and Further Reading
- The Kobeissi Letter. "The middle class is gone" — thread on X (Twitter), October 3, 2026. x.com/KobeissiLetter/status/2106396378259681615
- Board of Governors of the Federal Reserve System. Financial Accounts of the United States (Z.1), Distributional Financial Accounts (DFA) section, 2026.
- US Bureau of Labor Statistics. Consumer Price Index (CPI-U), monthly publications, 2020–2026.
- US Department of the Treasury. Daily Treasury Par Yield Curve Rates, 30-Year Treasury Constant Maturity, 2026.
- Saez E., Zucman G. Wealth Inequality in the United States since 1913 // Quarterly Journal of Economics, 2016 (estimates of top 1% share prior to 1989).
- Arrighi G. The Long Twentieth Century. Verso, 1994 (framework on "financialization as a late-phase hallmark").
- Moody's Analytics. Consumer expenditure distribution estimates by decile, 2025.
- IMF. Currency Composition of Official Foreign Exchange Reserves (COFER), 2000–2026.
- American Farm Bureau Federation. Market Intel: Farm Bankruptcies Continued to Climb in 2025, February 2026; USDA farm income forecast, 2026.
- Public Citizen. Ballroom Billions, November 2025; USA Today: What's in the contract for the White House ballroom?, April 2026.
- Reuters. Supreme Court lets Trump's White House ballroom construction continue, August 31, 2026.
- Associated Press. Review of federal court order violations, 2026.